
A CFO dashboard must deliver more than KPI monitoring. It should bridge high-level oversight, operational depth, and concrete decision support. The architecture unites Executive Overview, Product Details, Decomposition Tree, Product Performance Overview, and regional maps into a coherent steering framework.
CFO Executive Dashboard: Performance, Pricing and Driver Analysis
This dashboard connects holistic financial steering with product economics, scenario analysis, and root-cause diagnostics. Decision-makers track revenue, profit, orders, and returns alongside product, category, and regional drivers to evaluate how operational and pricing shifts impact performance.
Core steering question
Which operational drivers explain current performance shifts, and where should pricing and portfolio decisions intervene?
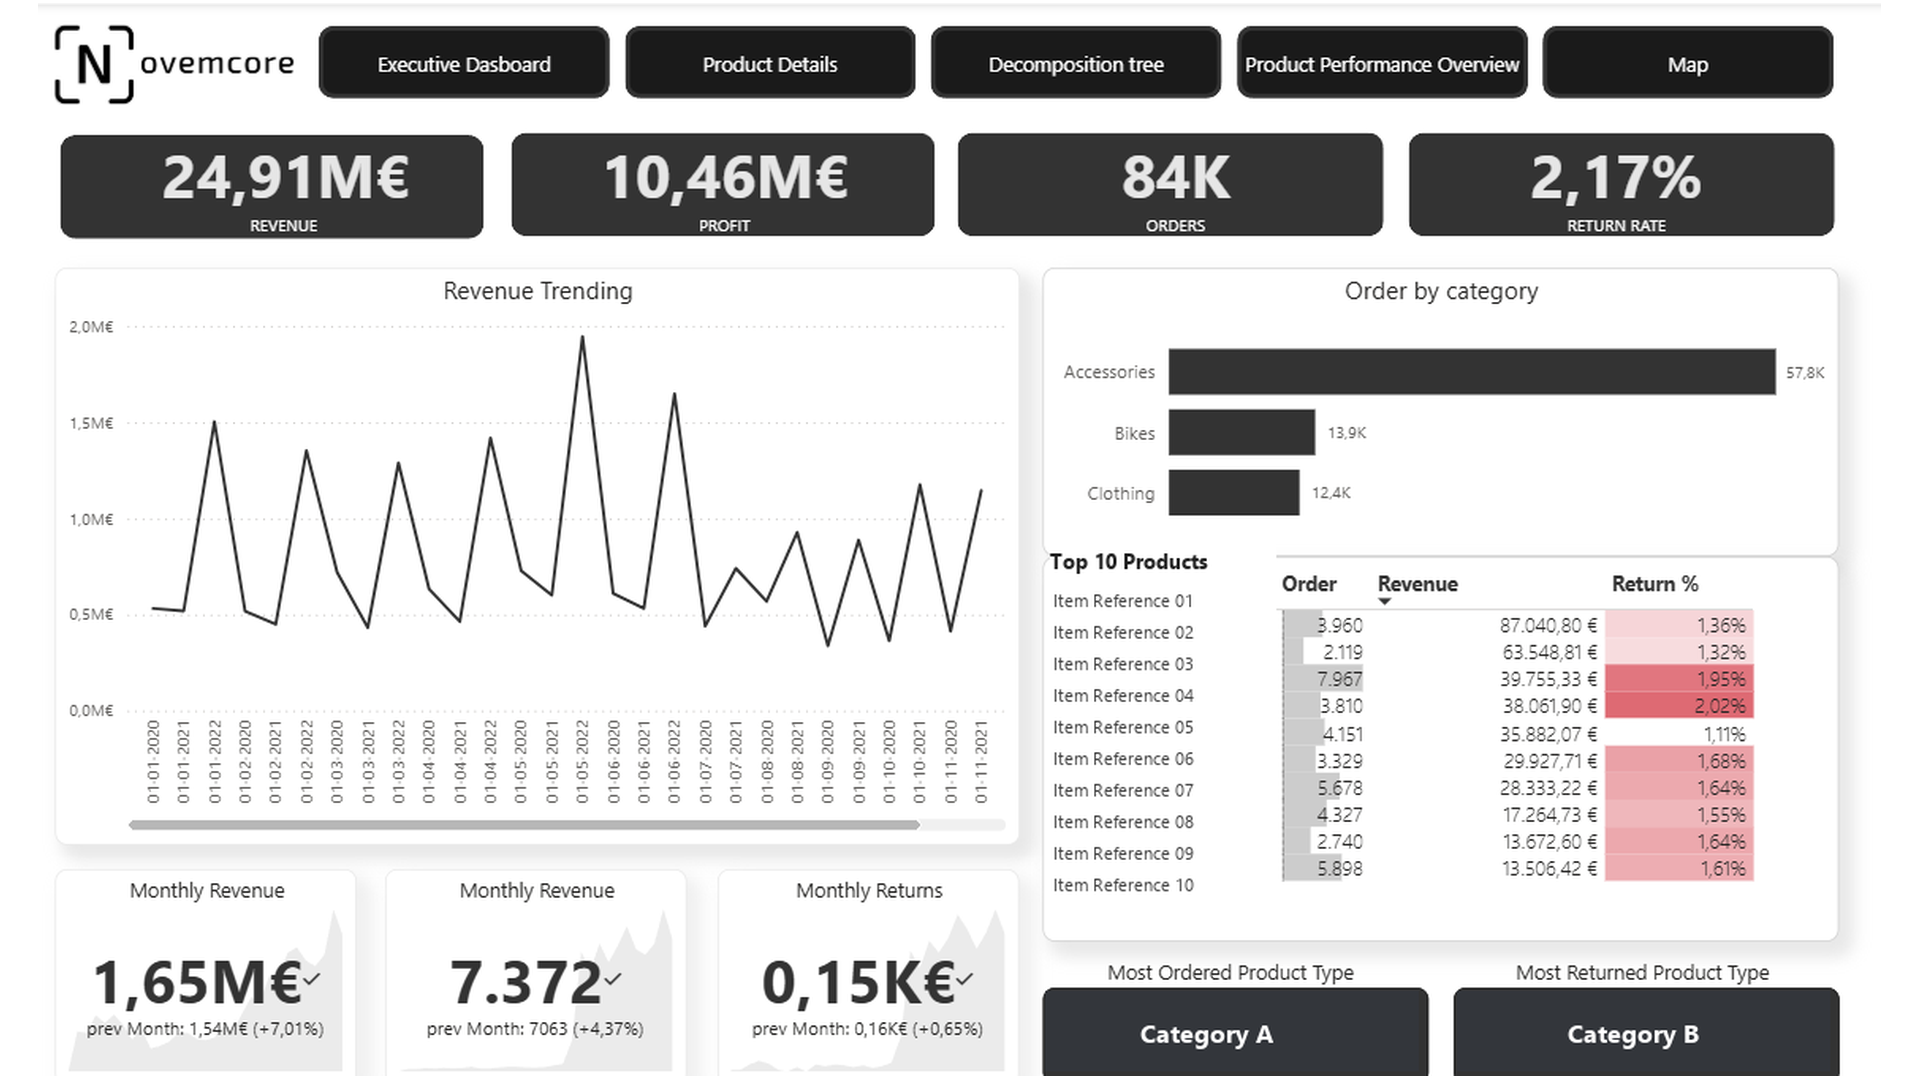
Anonymized dashboard reference. Selected views approved for publication are shown.
- Revenue, Gross Profit, and Order Volume
- Return Rate and Monthly Margin Trajectory
- Product, Category, and Regional Drivers
What the dashboard shows
Available Dashboard Views
VIEW DETAIL
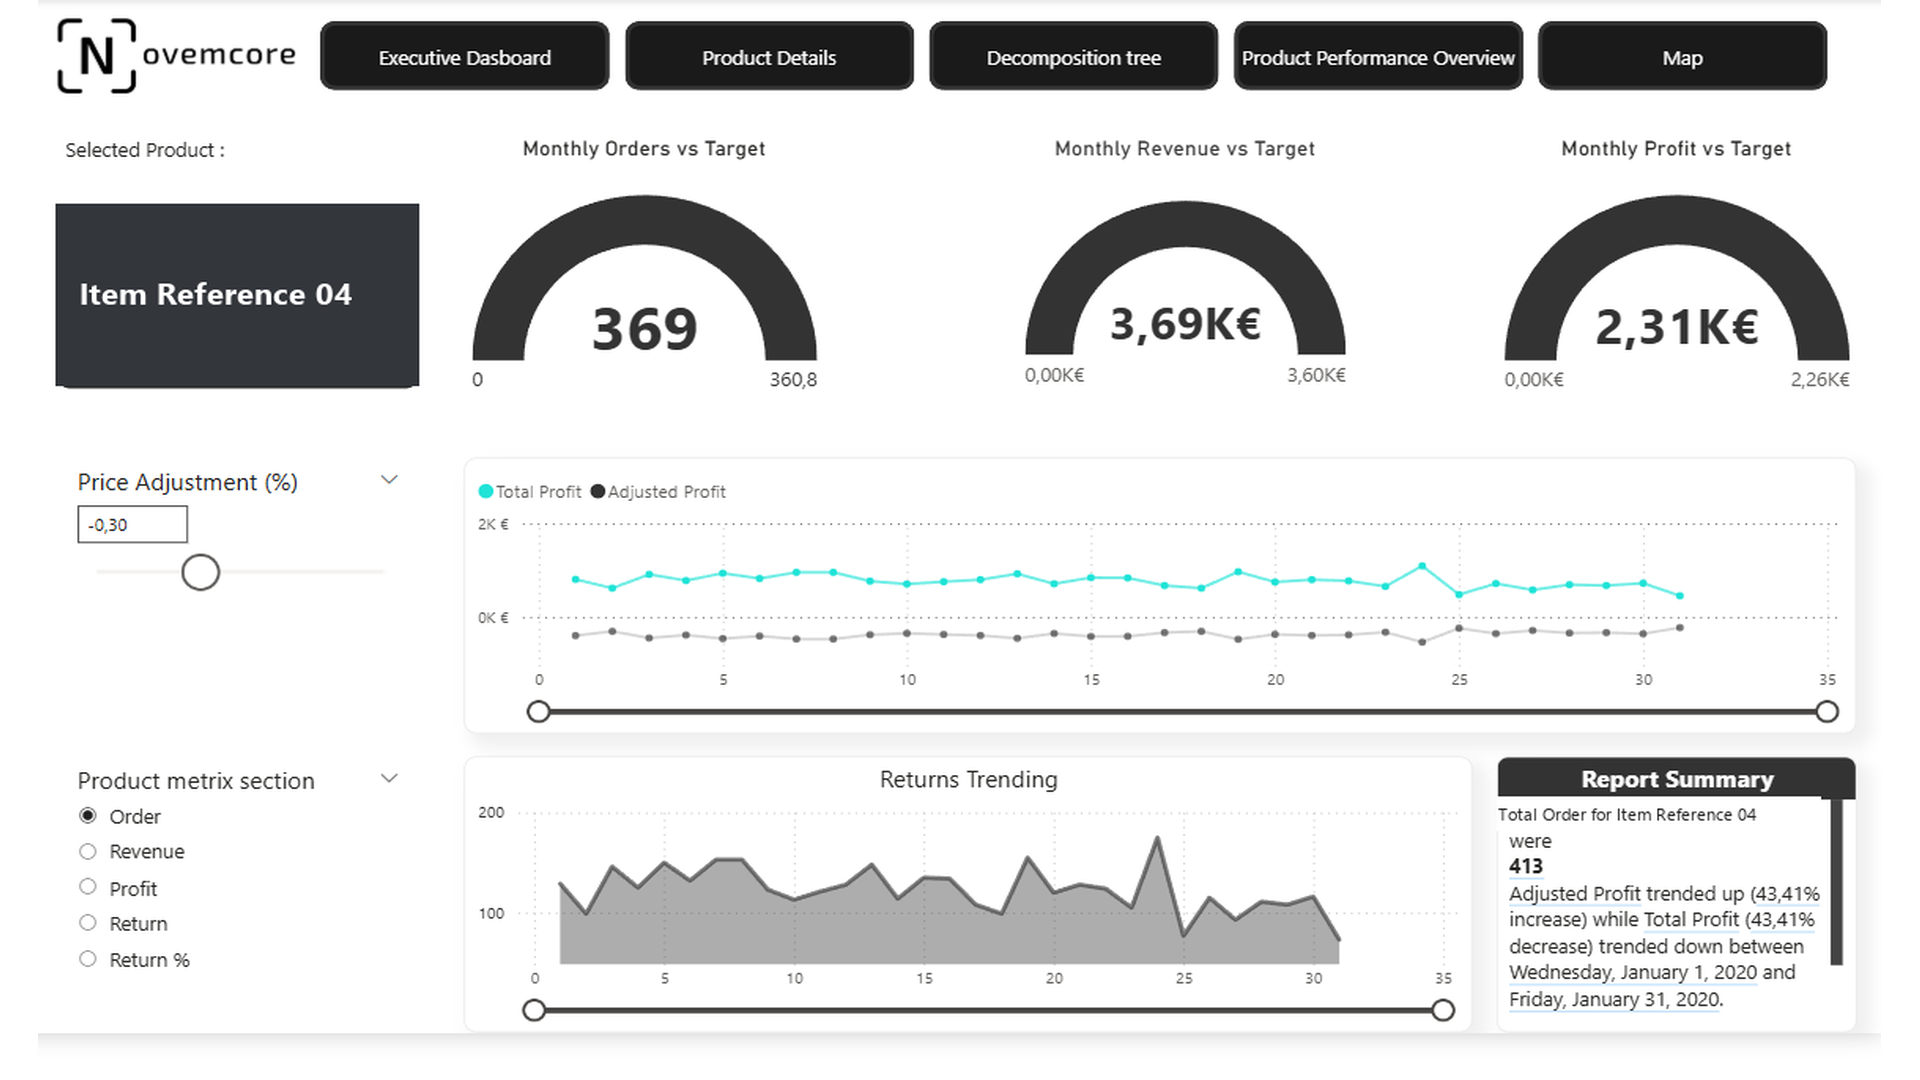
Product Details & Price Scenarios
Connects operational product metrics with scenario logic: simulate how price adjustments shift revenue, profit, orders, and return rates at item level before market rollout.
Management value
Simulate pricing elasticity and unit contribution margins prior to implementation to safeguard sales volume.
VIEW DETAIL
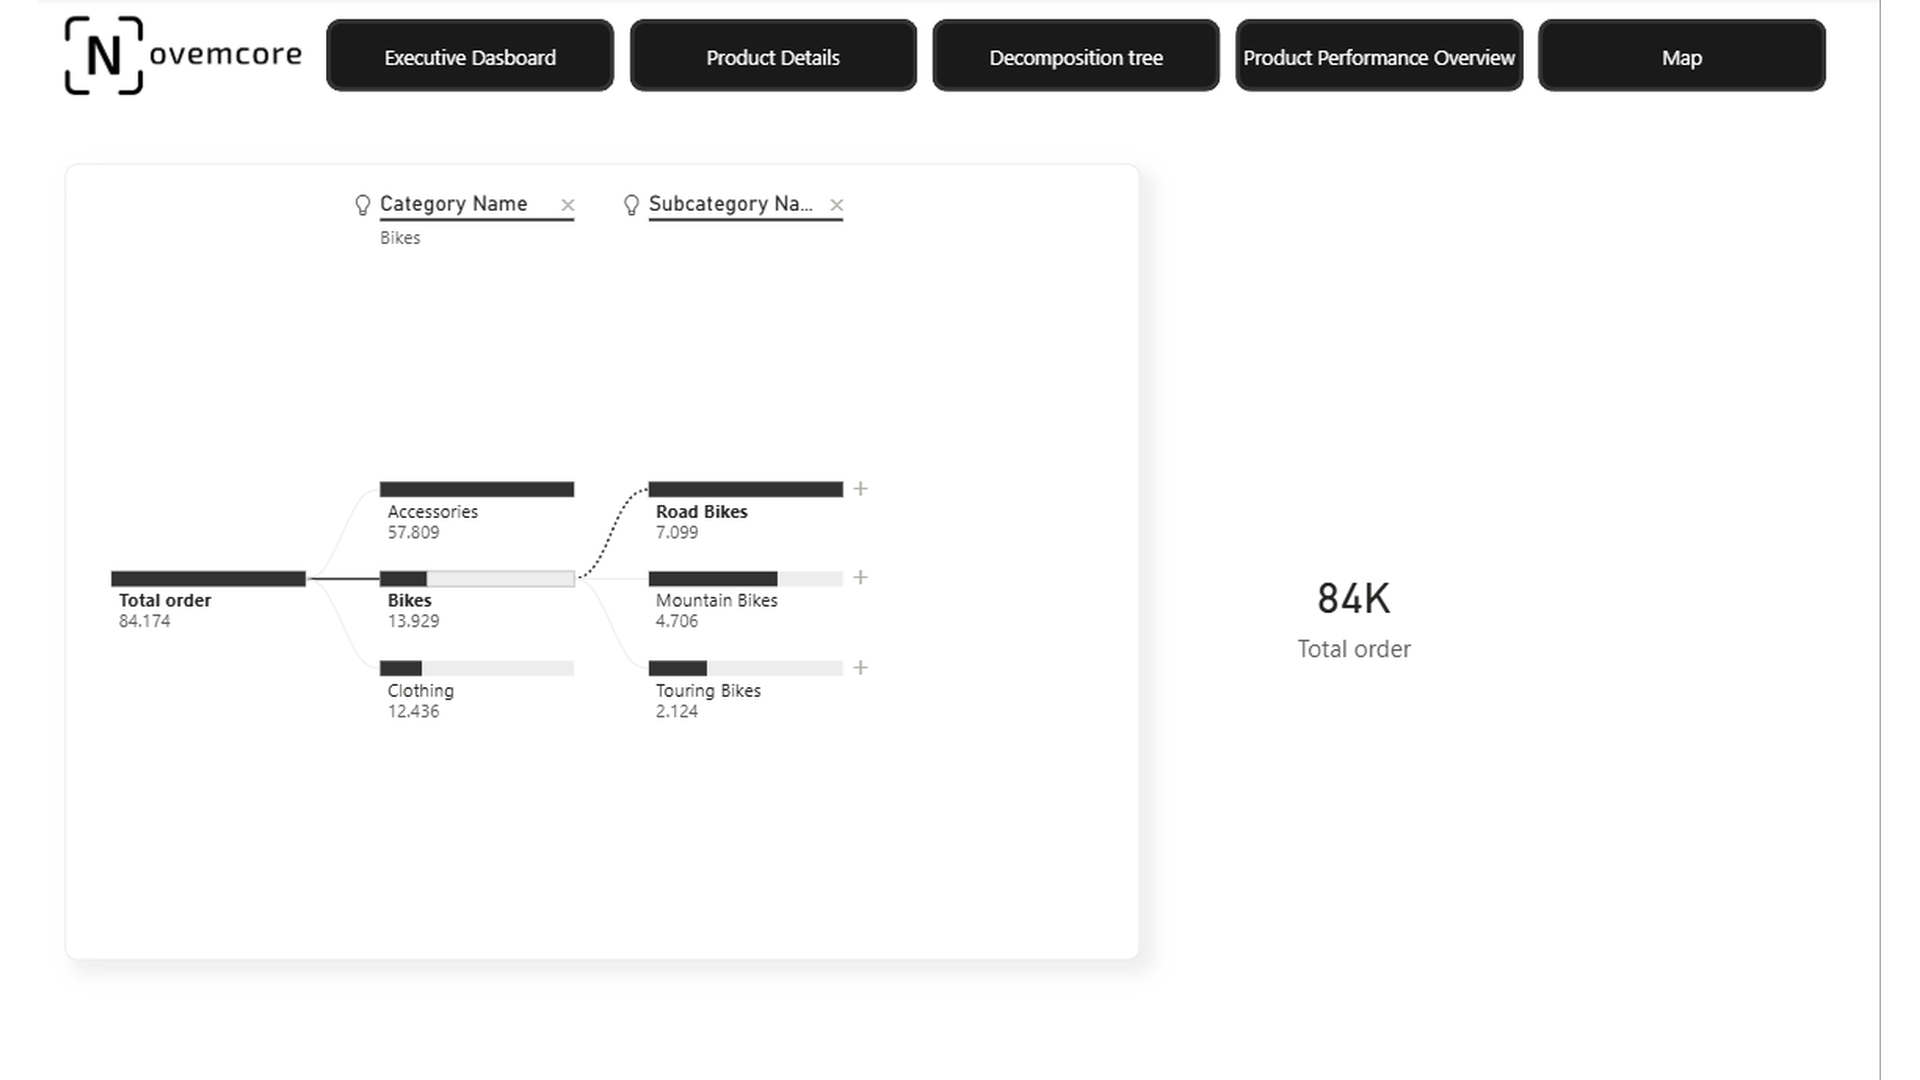
Decomposition Tree (Root-Cause Analysis)
Breaks down high-level profit and margin variances across categories and subcategories to reveal the true underlying drivers.
Management value
Instant root-cause isolation separating structural profit drivers from temporary one-off variances.
VIEW DETAIL
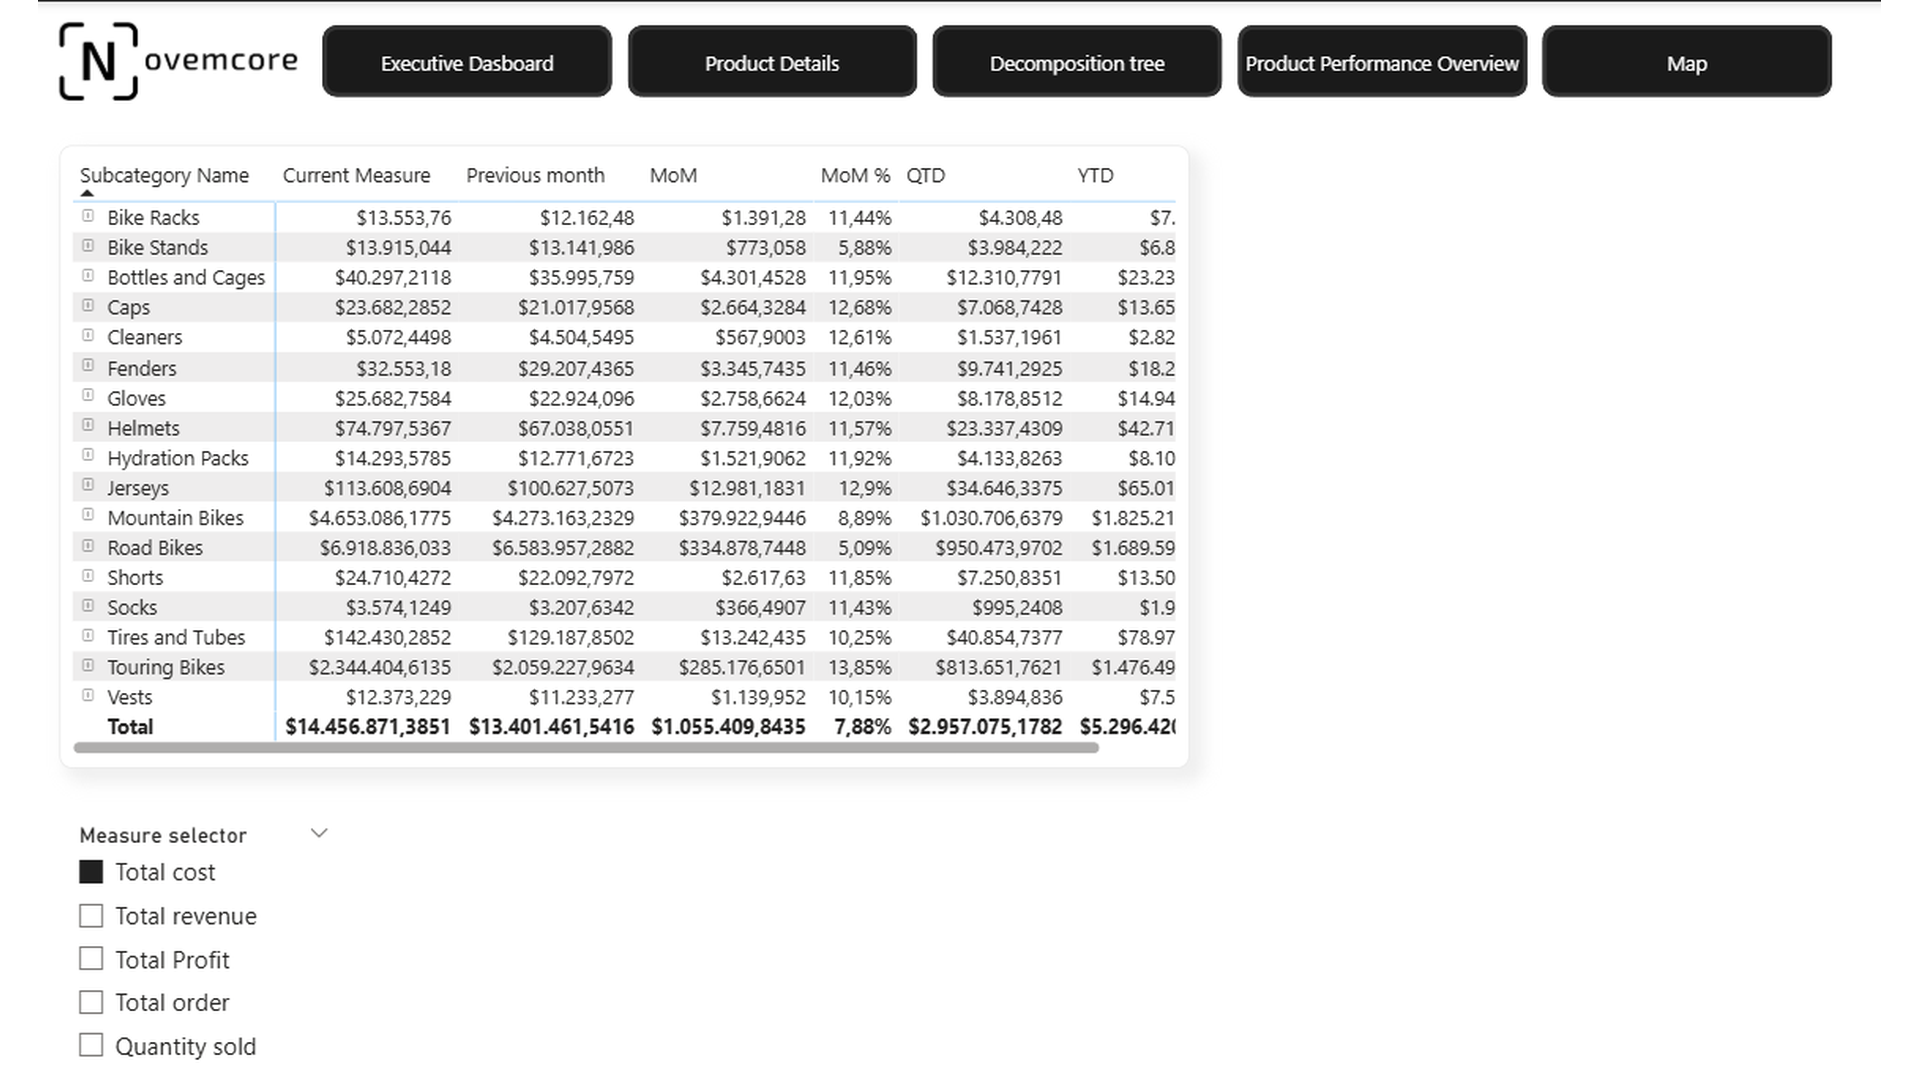
Product Performance Overview
Expands performance diagnosis to compare subcategory metrics across monthly, quarterly, and year-to-date trajectories to detect structural growth discrepancies.
Management value
Informs portfolio optimization and assortment governance where cost, price, or return dynamics deviate from plan.
VIEW DETAIL
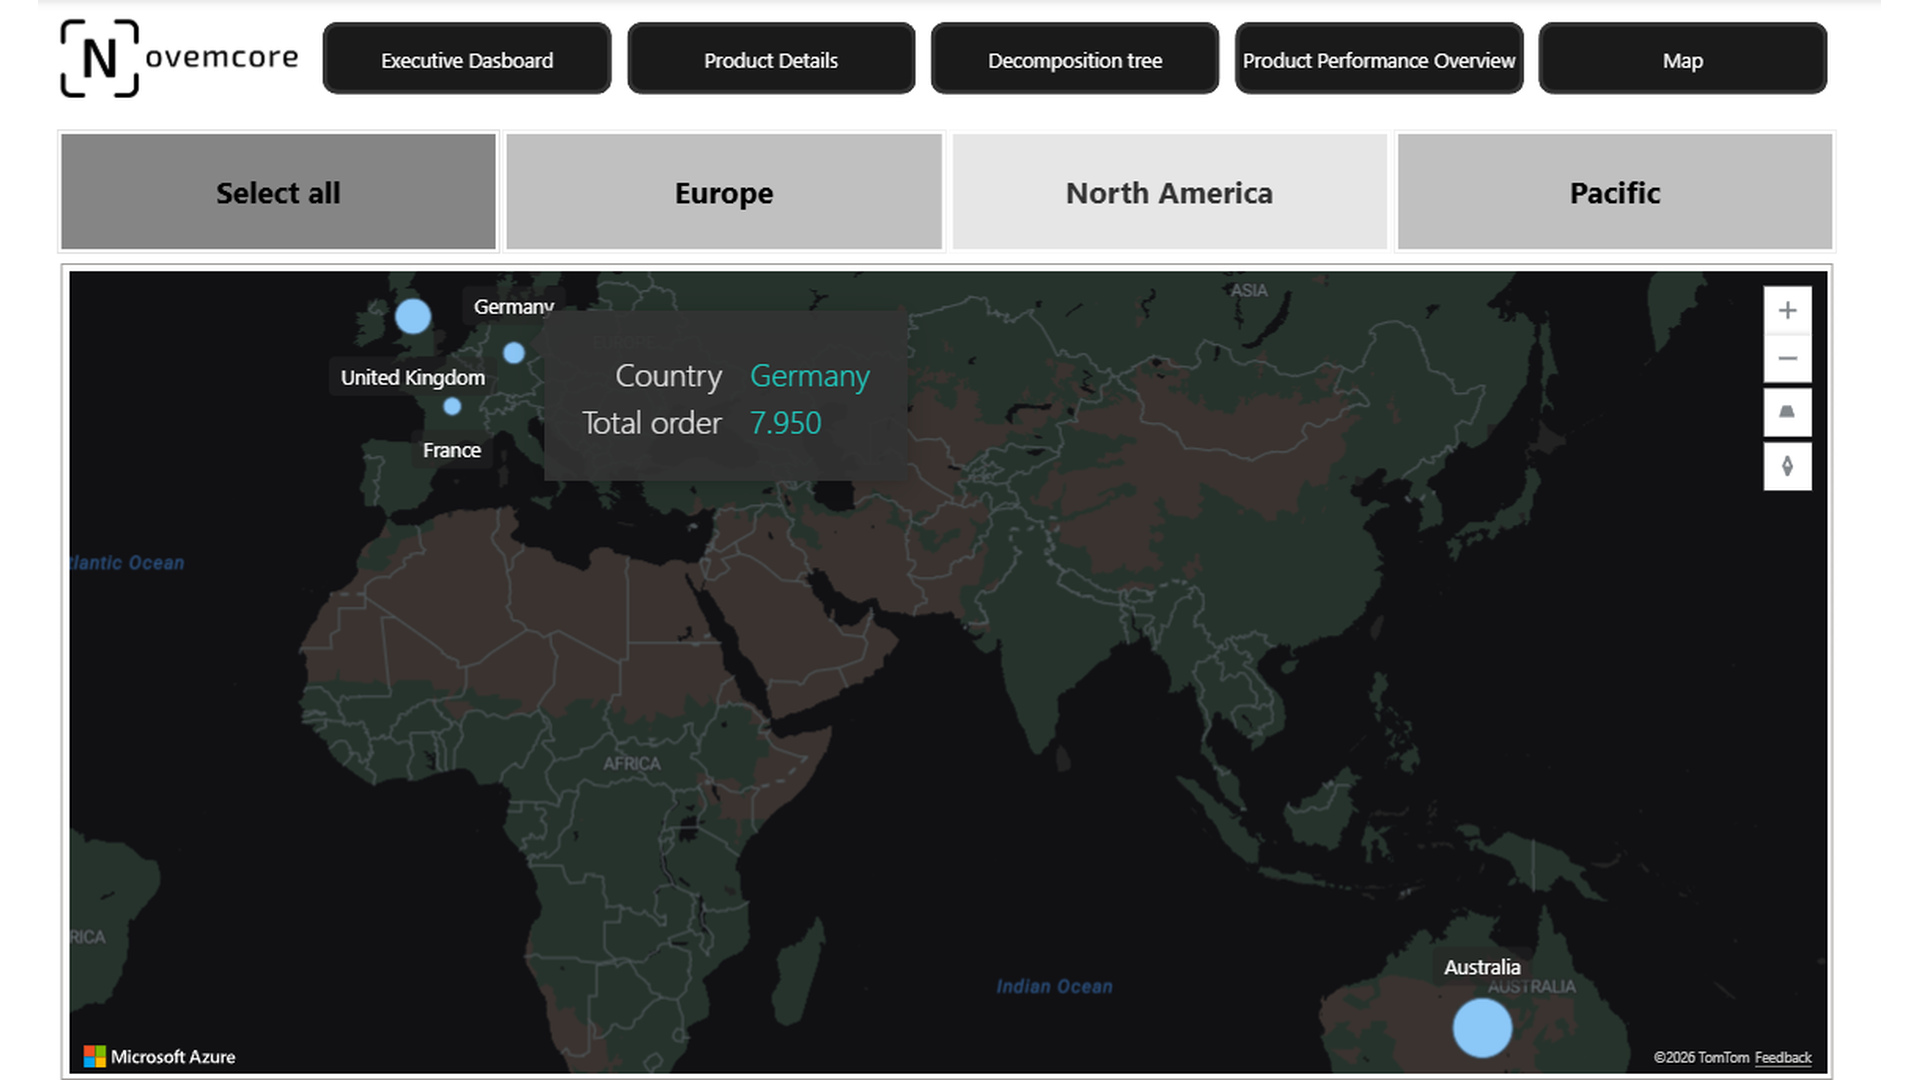
Map (Regional Distribution)
Complements product metrics with geographic distribution, highlighting regional strongholds and underperforming markets.
Management value
Geographic transparency to optimize commercial resource allocation and target localized market potential.
- Executive Overview for rapid orientation across fiscal and operational performance
- Product detail analysis with price adjustment scenario simulations
- Decomposition Tree for systematic root-cause diagnosis of profit variances
- Product Performance Overview for granular comparison across subcategories
- Geographic map view to pinpoint regional performance variations
01Executive KPI Architecture
02Dynamic Scenario & Price Modelling
03Root-Cause Driver Analysis
04Multi-Dimensional Portfolio Segmentation
Next step
Discuss your reporting requirements Which decisions should your reporting support better?
We connect data modelling, KPI logic and Power BI development in a reporting solution designed around your steering processes.