
Effective finance performance management starts when revenue, cost, and profitability views are no longer kept separate. This dashboard unifies these perspectives into a single governance framework, making financial cause-and-effect transparent.
Finance Performance Management Dashboard: Seamless Governance of Revenue, Cost and Profitability
This dashboard delivers an integrated view across revenue, costs, and earnings. It connects Executive Summary, Revenue Analysis, Cost & Expense, and Profitability in a unified finance model that highlights both high-level KPIs and their underlying drivers.
Core steering question
How do revenue and earnings compare to plan, and which cost or margin drivers account for deviations?
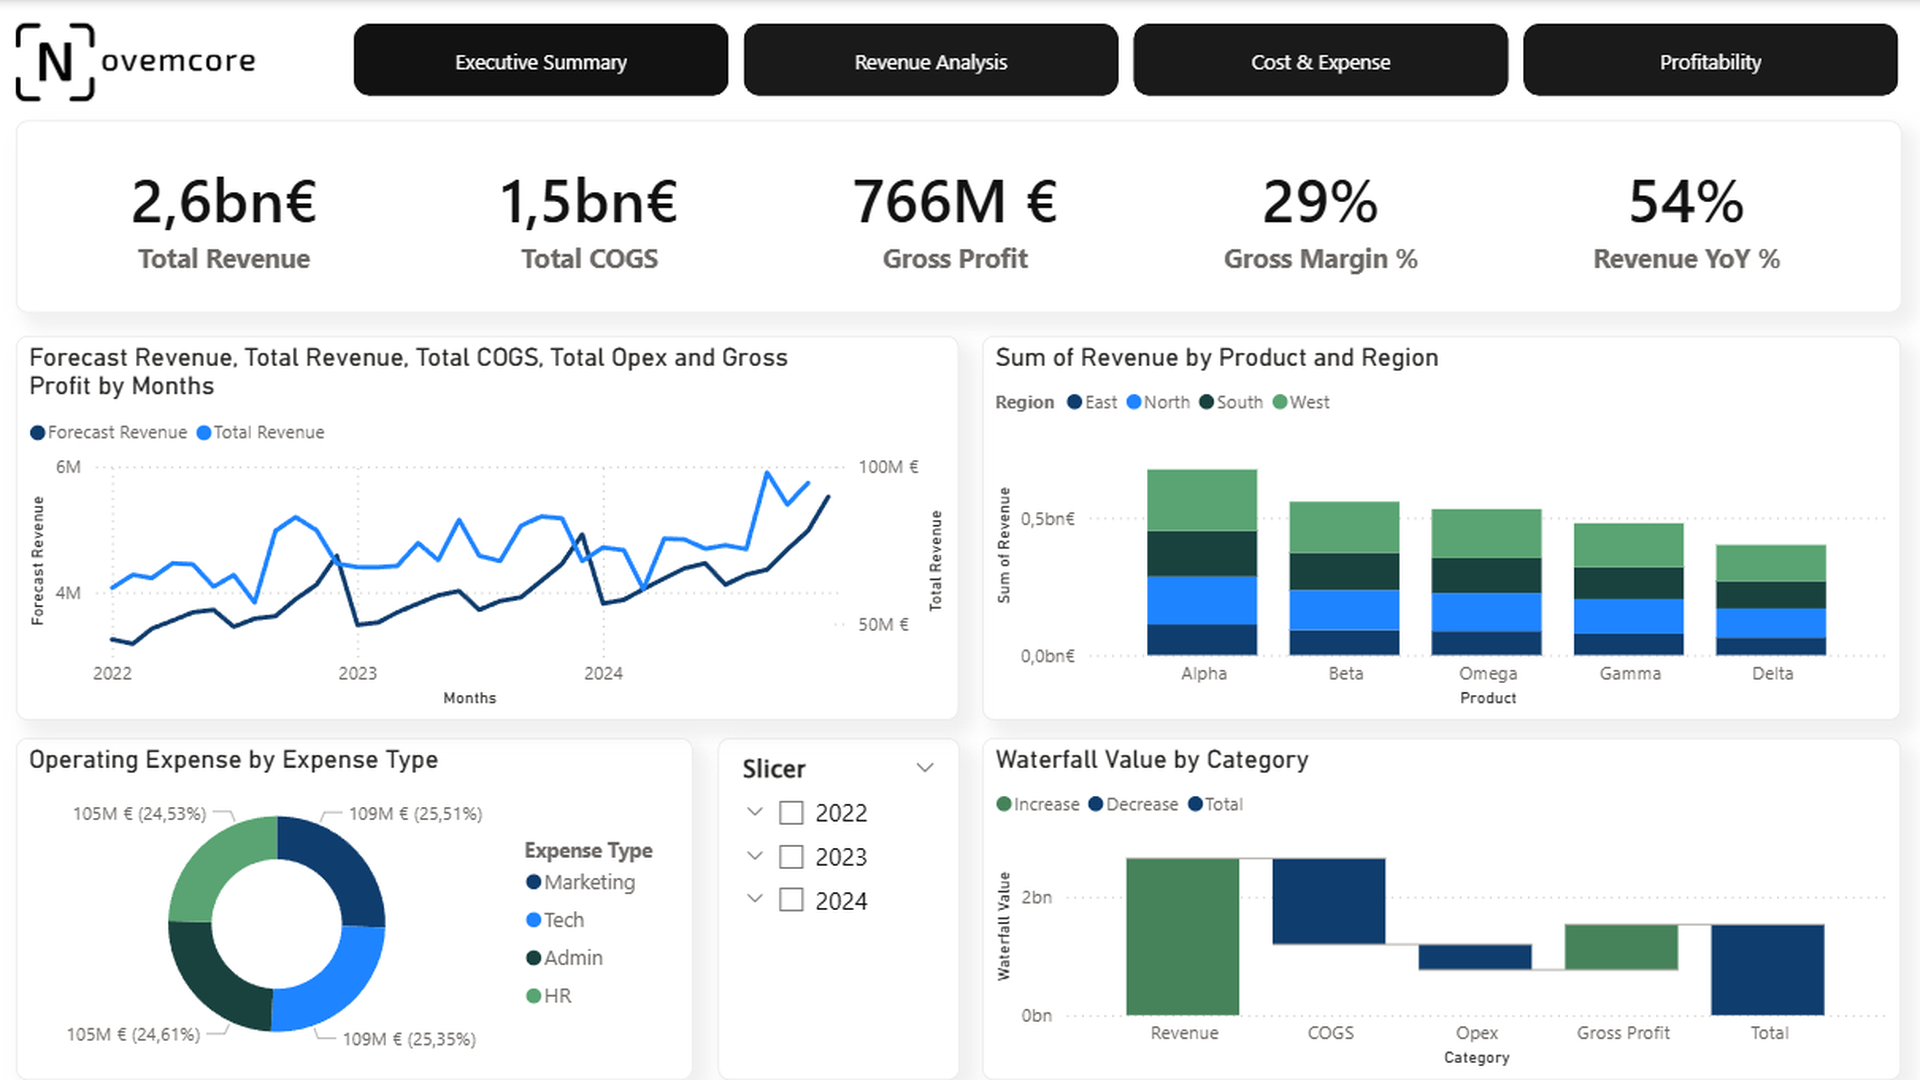
Anonymized dashboard reference. Selected views approved for publication are shown.
- Revenue, COGS, and Gross Profit
- Gross Margin % and Revenue YoY Growth
- Actual vs. Forecast Variance and Opex Trends
What the dashboard shows
Available Dashboard Views
VIEW DETAIL
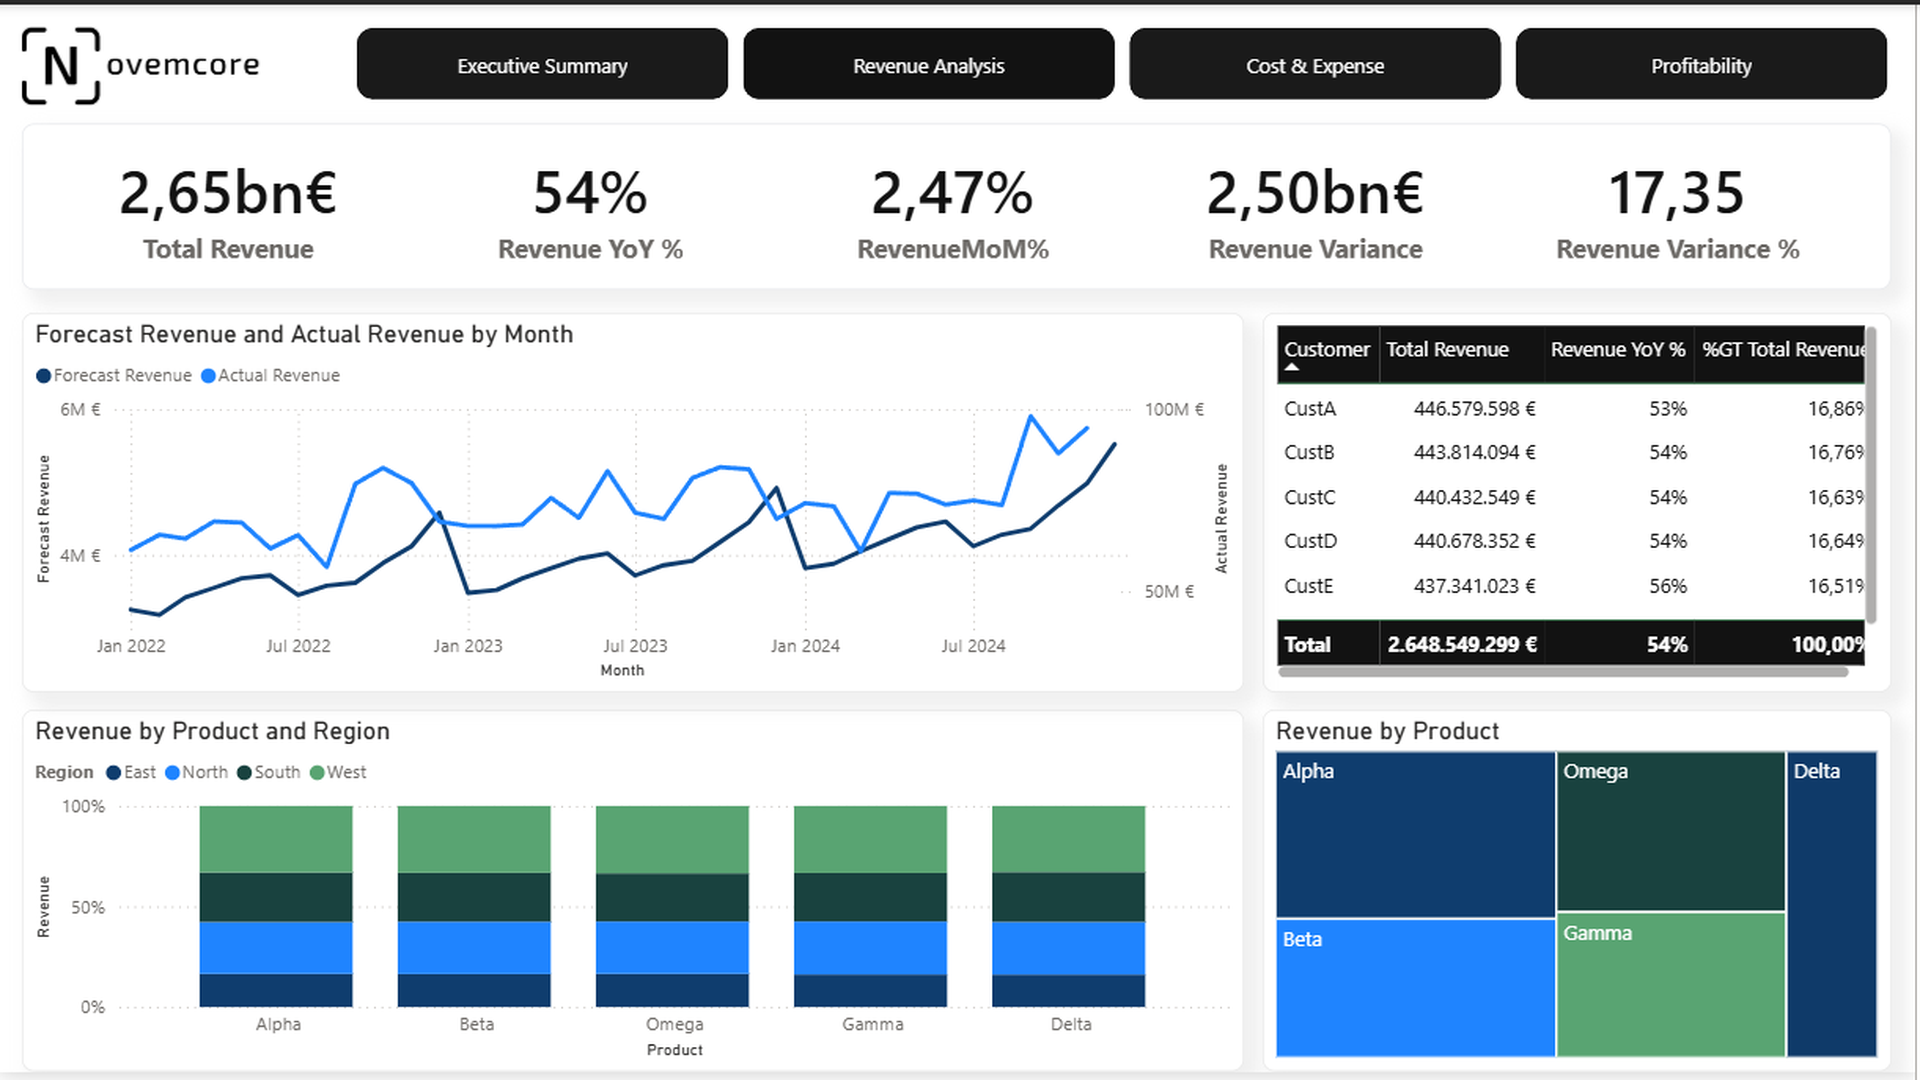
Revenue Analysis
Deep-dives into top-line revenue development across products, regions, and customer accounts with actual vs. forecast tracking and concentration analytics.
Management value
Enables finance teams to detect account concentration risks, plan deviations, and regional growth trajectories.
VIEW DETAIL
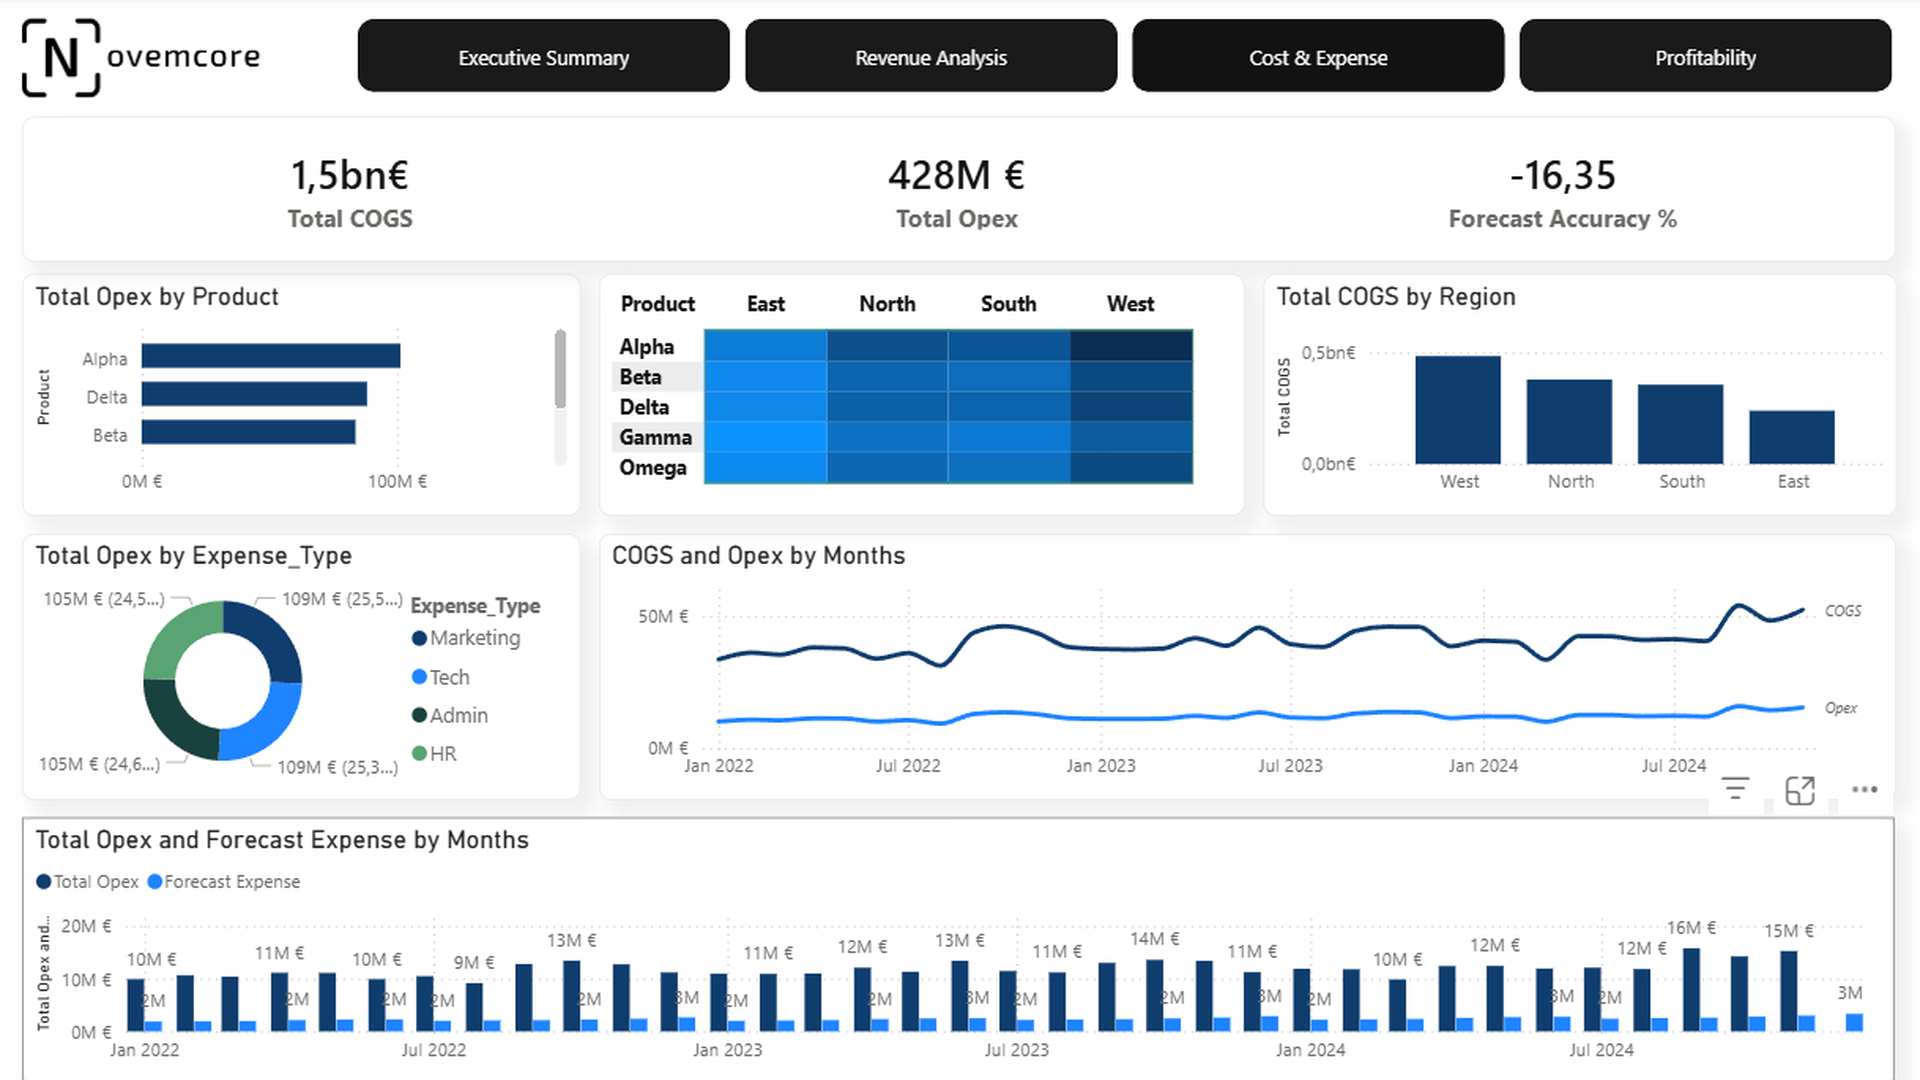
Cost & Expense
Delivers full cost transparency across COGS and operating expenses, tracking cost breakdowns by product line, region, and expense category over time.
Management value
Pinpoints operating cost inflation and prioritizes efficiency initiatives in planning cycles.
VIEW DETAIL
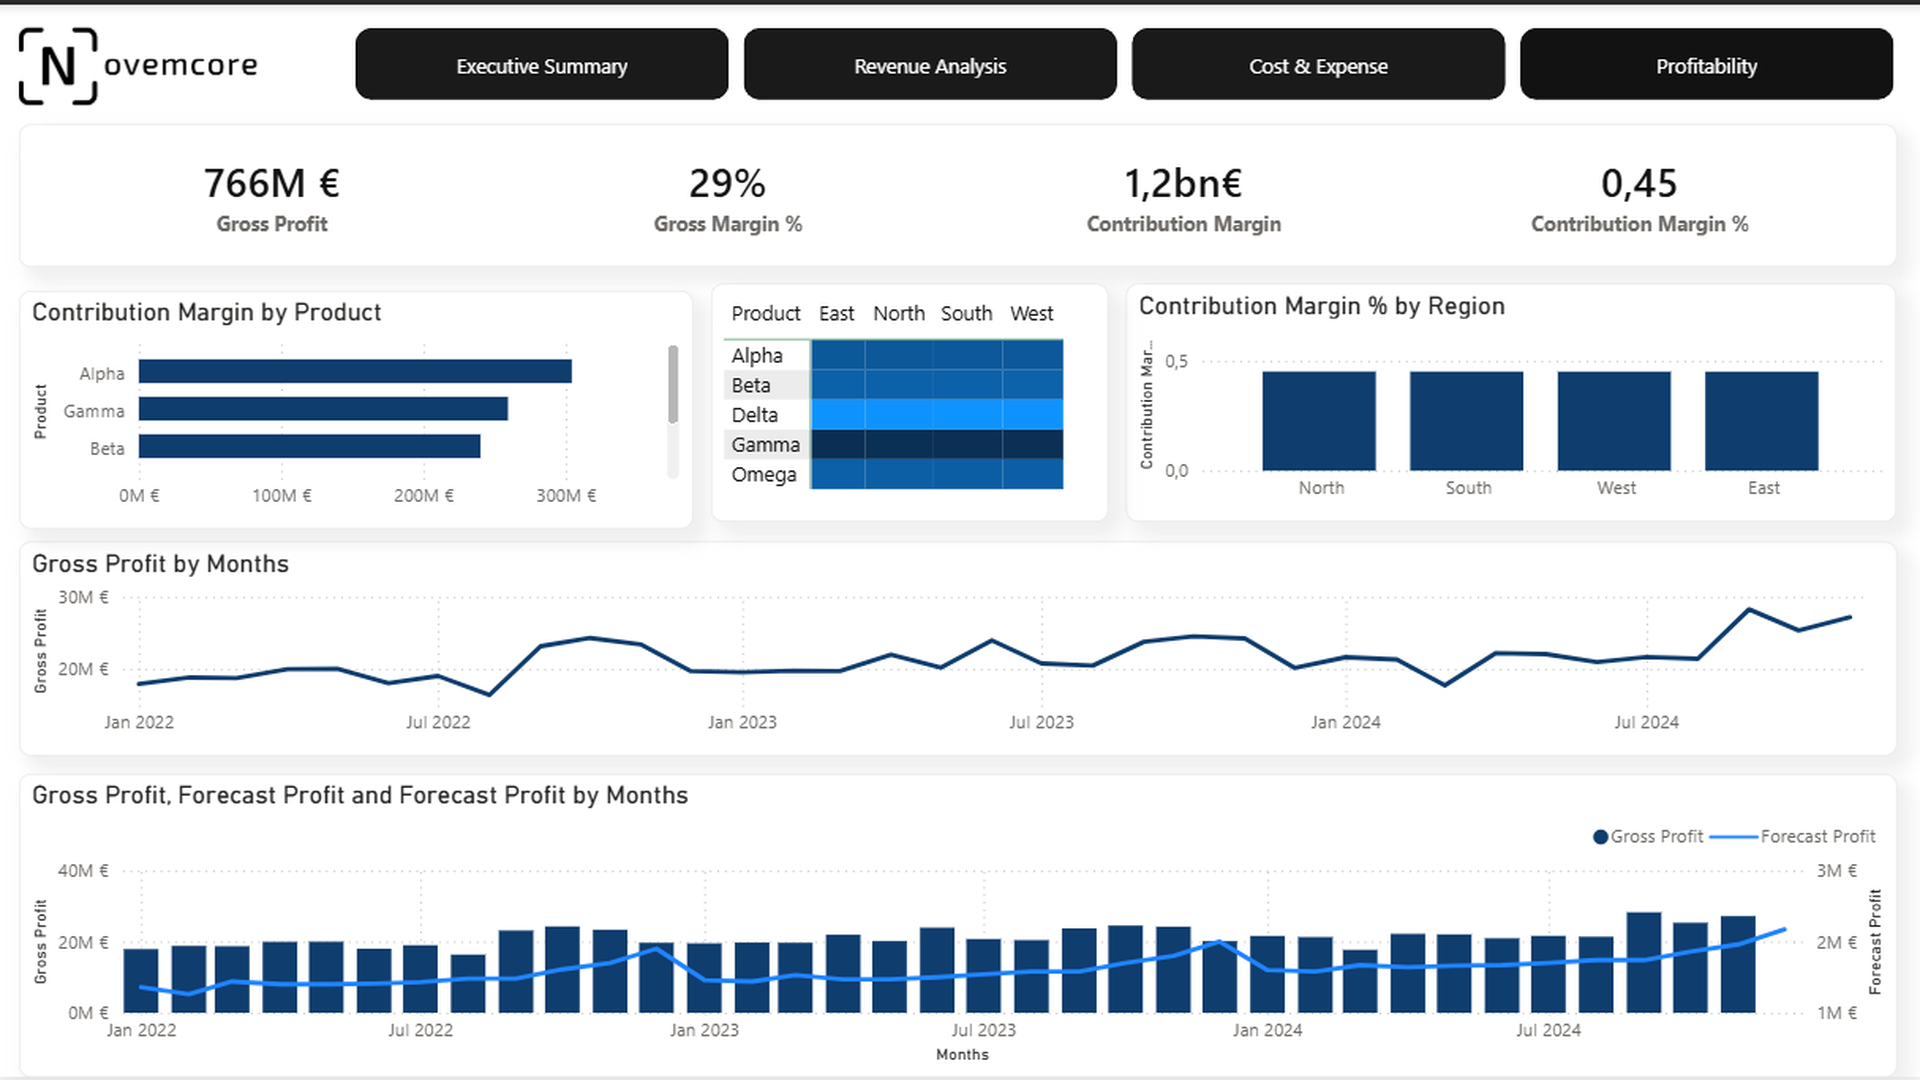
Profitability
Synthesizes revenue and cost dimensions to track contribution margin and gross profit progression across products, geographies, and time.
Management value
Provides transparent contribution margin visibility to identify unprofitable product and market segments.
- Executive Summary for ongoing monitoring of overall fiscal health
- Forecast variance analysis to identify budget deviations early
- Cost & expense breakdowns to isolate operating expense drivers across cost centres
- Cost driver prioritization to guide profitability actions in planning cycles
01Financial Data Architecture
02Forecast Variance Modelling
03Cost-Centre & Opex Structuring
04Multi-Tier Profitability Analysis
Next step
Discuss your reporting requirements Which decisions should your reporting support better?
We connect data modelling, KPI logic and Power BI development in a reporting solution designed around your steering processes.