
Power BI dashboards built for better decisions.
Selected references for management reporting, operational steering and data-led decisions. The examples show how Novemcore connects data models, KPIs and visual design without exposing sensitive client information.
Four perspectives, one ambition: connect metrics so teams can understand, prioritise and act faster.
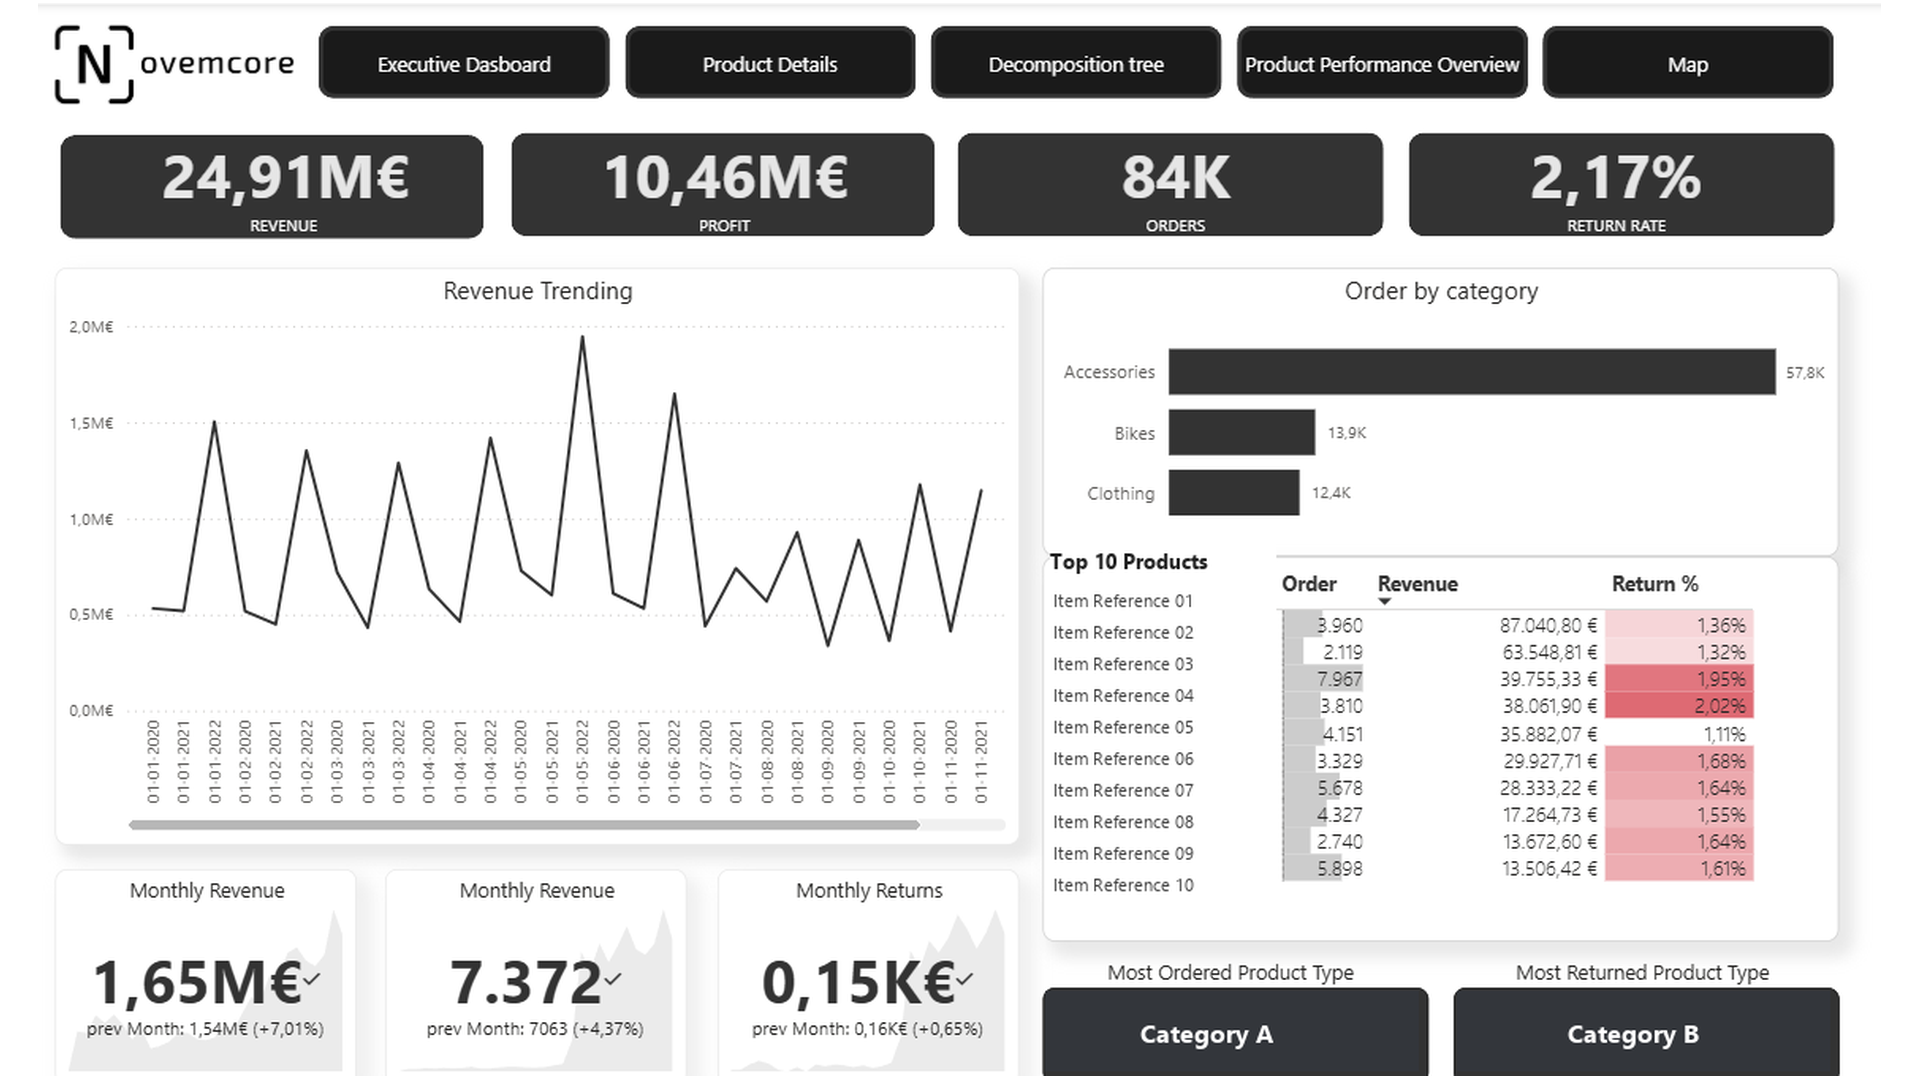
CFO Executive Dashboard: Performance, Pricing and Driver Analysis
This dashboard connects holistic financial steering with product economics, scenario analysis, and root-cause diagnostics. Decision-makers track revenue, profit, orders, and returns alongside product, category, and regional drivers to evaluate how operational and pricing shifts impact performance.
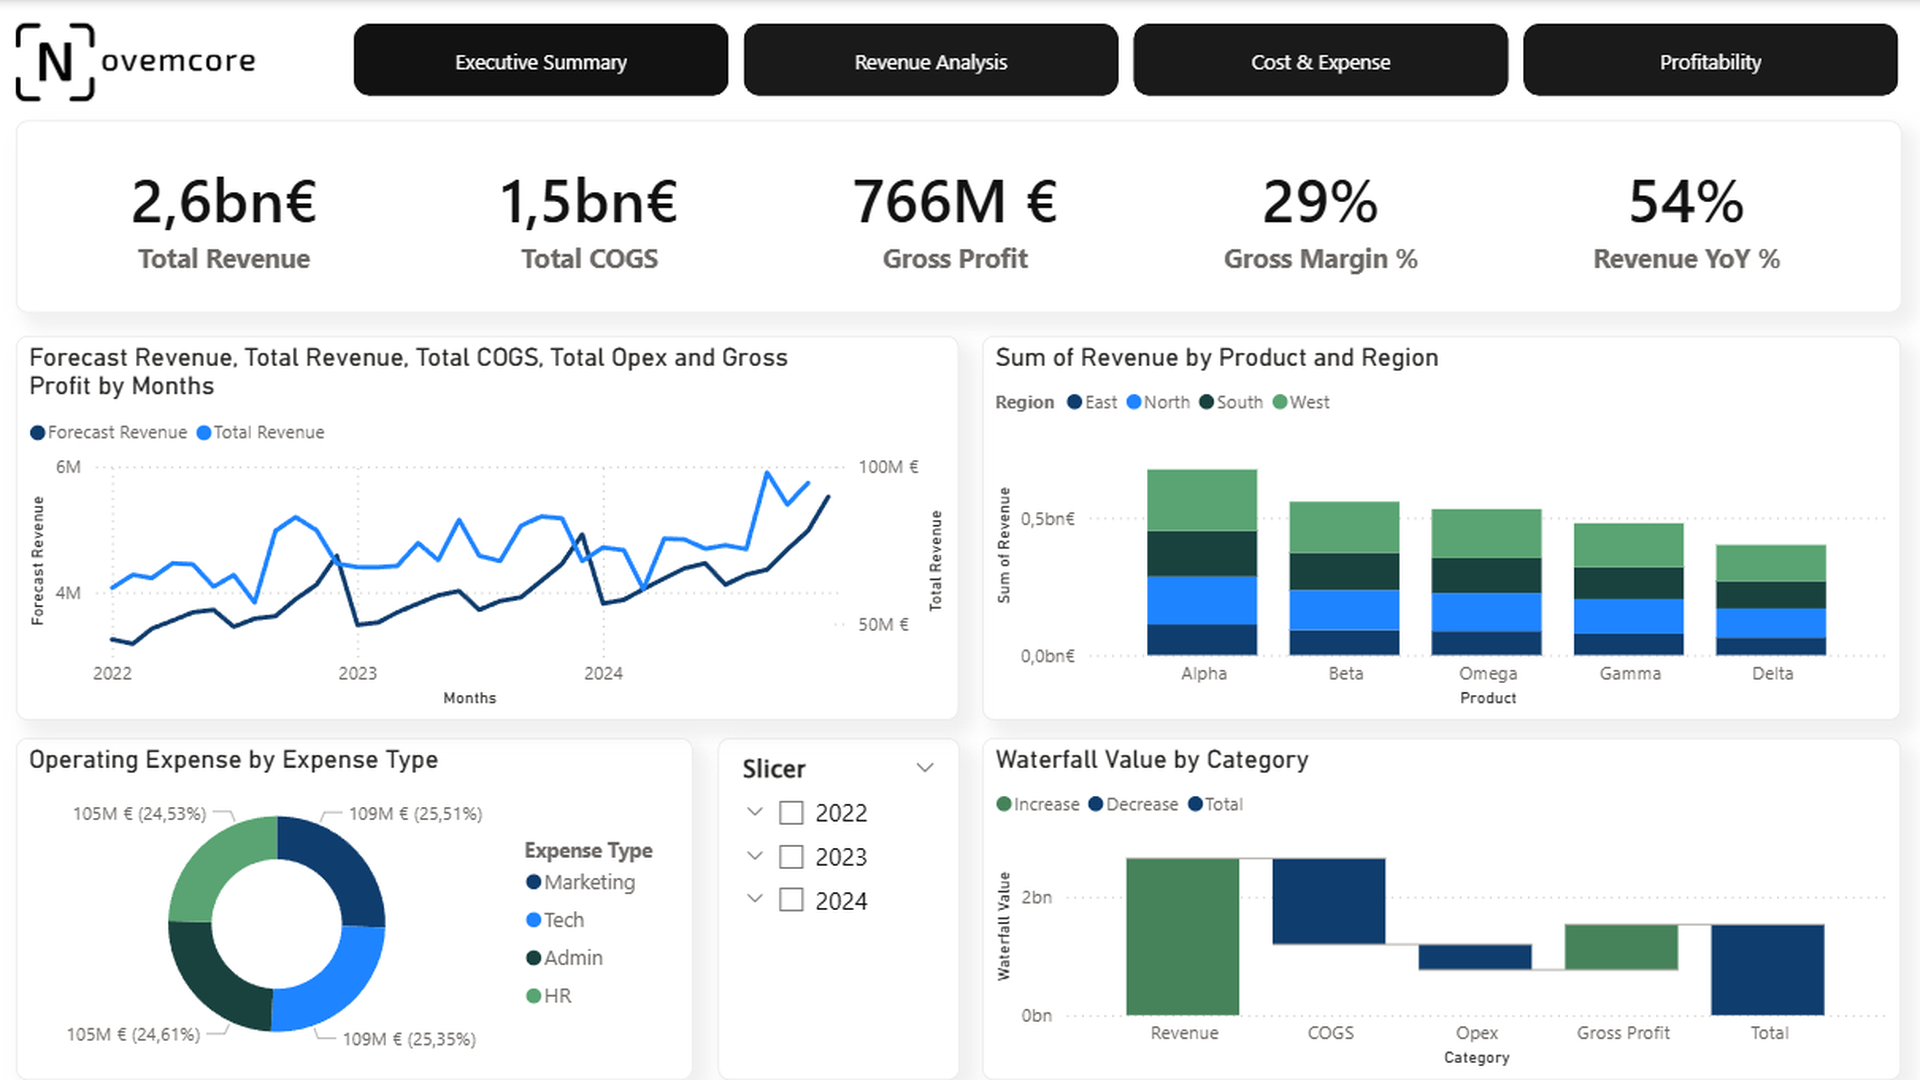
Finance Performance Management Dashboard: Seamless Governance of Revenue, Cost and Profitability
This dashboard delivers an integrated view across revenue, costs, and earnings. It connects Executive Summary, Revenue Analysis, Cost & Expense, and Profitability in a unified finance model that highlights both high-level KPIs and their underlying drivers.
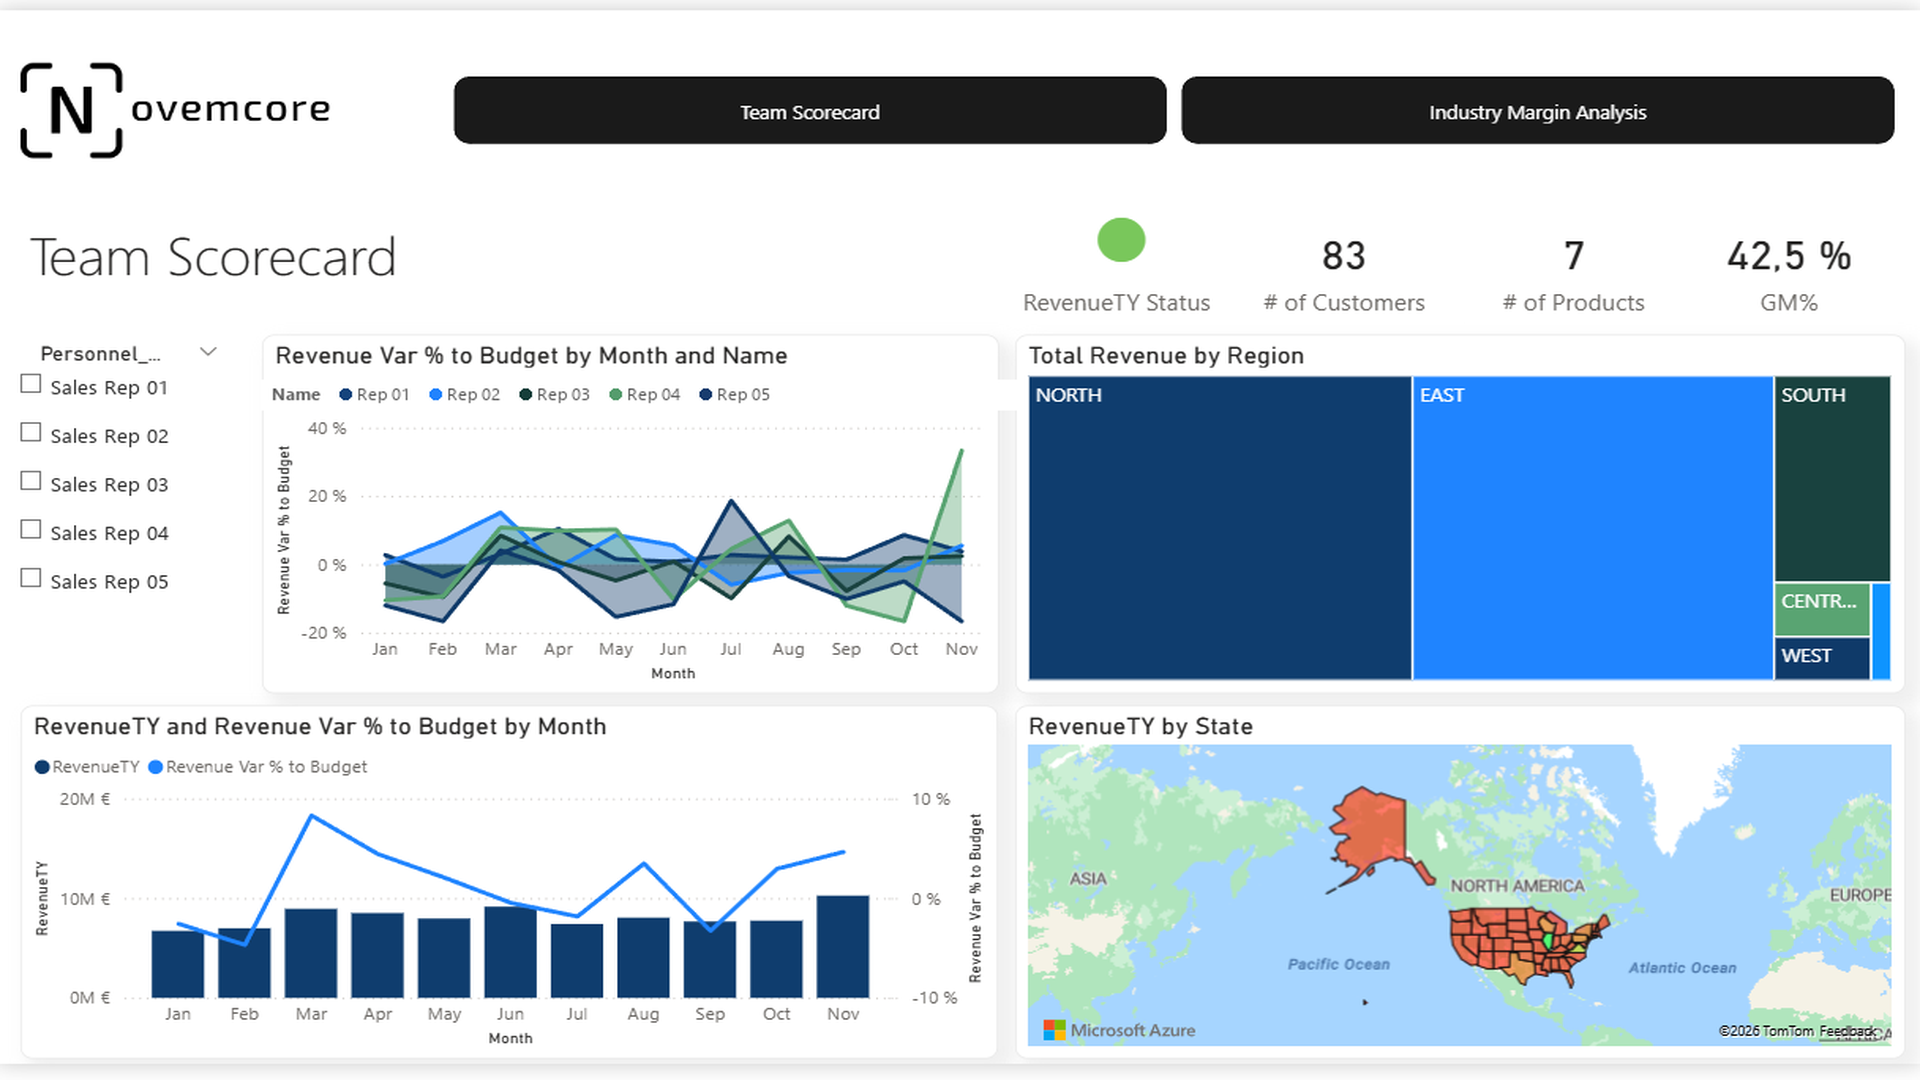
Sales & Margin Steering Dashboard: Aligning Commercial Growth and Margin Governance
This dashboard integrates commercial sales performance with margin steering in a unified view. It tracks quota achievement alongside team, industry, product, and regional profitability to ensure growth remains economically viable.
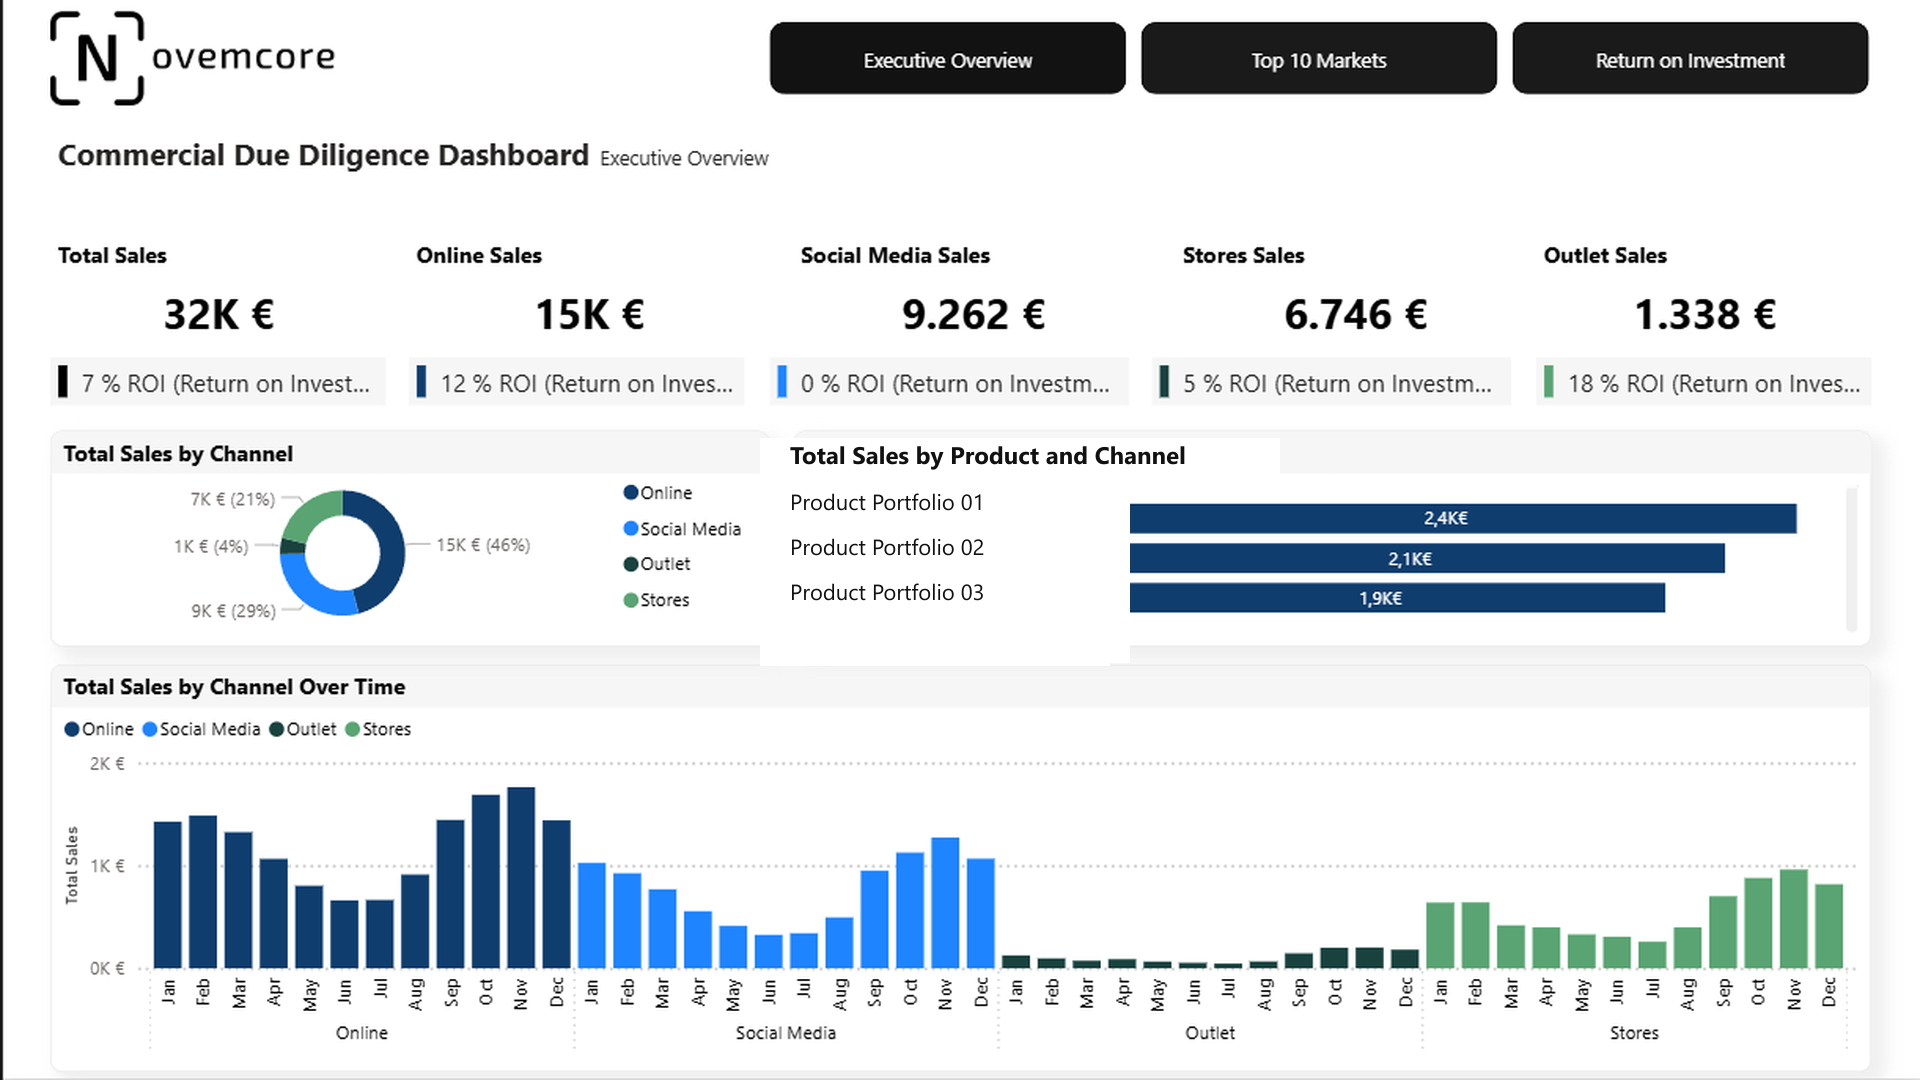
Commercial Due Diligence Dashboard: Markets, Channels and ROI in an Integrated View
This dashboard establishes a dependable view of commercial performance, market attractiveness, and investment efficiency. It highlights revenue distribution alongside high-leverage markets and channels to evaluate true value contribution.
Strong dashboards do not start with charts. They connect a clear steering problem, a reliable KPI model and a visual language that works for the people using it.
KPI modelling
Consistent DAX logic, standardized calculation rules, and clean separation between driver and outcome metrics.
Management reporting
Executive dashboards with structured visual hierarchy for swift monthly and quarterly business reviews.
Operational steering
Deep-dive views with filter chains, decomposition trees, and operational root-cause diagnostics.
Power BI development
Performance-tuned semantic models, tailored visuals, and strict privacy-first publishing standards.
Which decisions should your reporting support better?
We connect data modelling, KPI logic and Power BI development in a reporting solution designed around your steering processes.