
Isolated revenue reporting is insufficient for Commercial Due Diligence. Strategic evaluation requires understanding market quality, channel durability, and capital efficiency. The dashboard integrates Executive Overview, Top 10 Market prioritization, and a dedicated ROI perspective.
Commercial Due Diligence Dashboard: Markets, Channels and ROI in an Integrated View
This dashboard establishes a dependable view of commercial performance, market attractiveness, and investment efficiency. It highlights revenue distribution alongside high-leverage markets and channels to evaluate true value contribution.
Core steering question
Which markets, channels, and products truly drive sustainable growth, and how efficiently are commercial investments deployed?
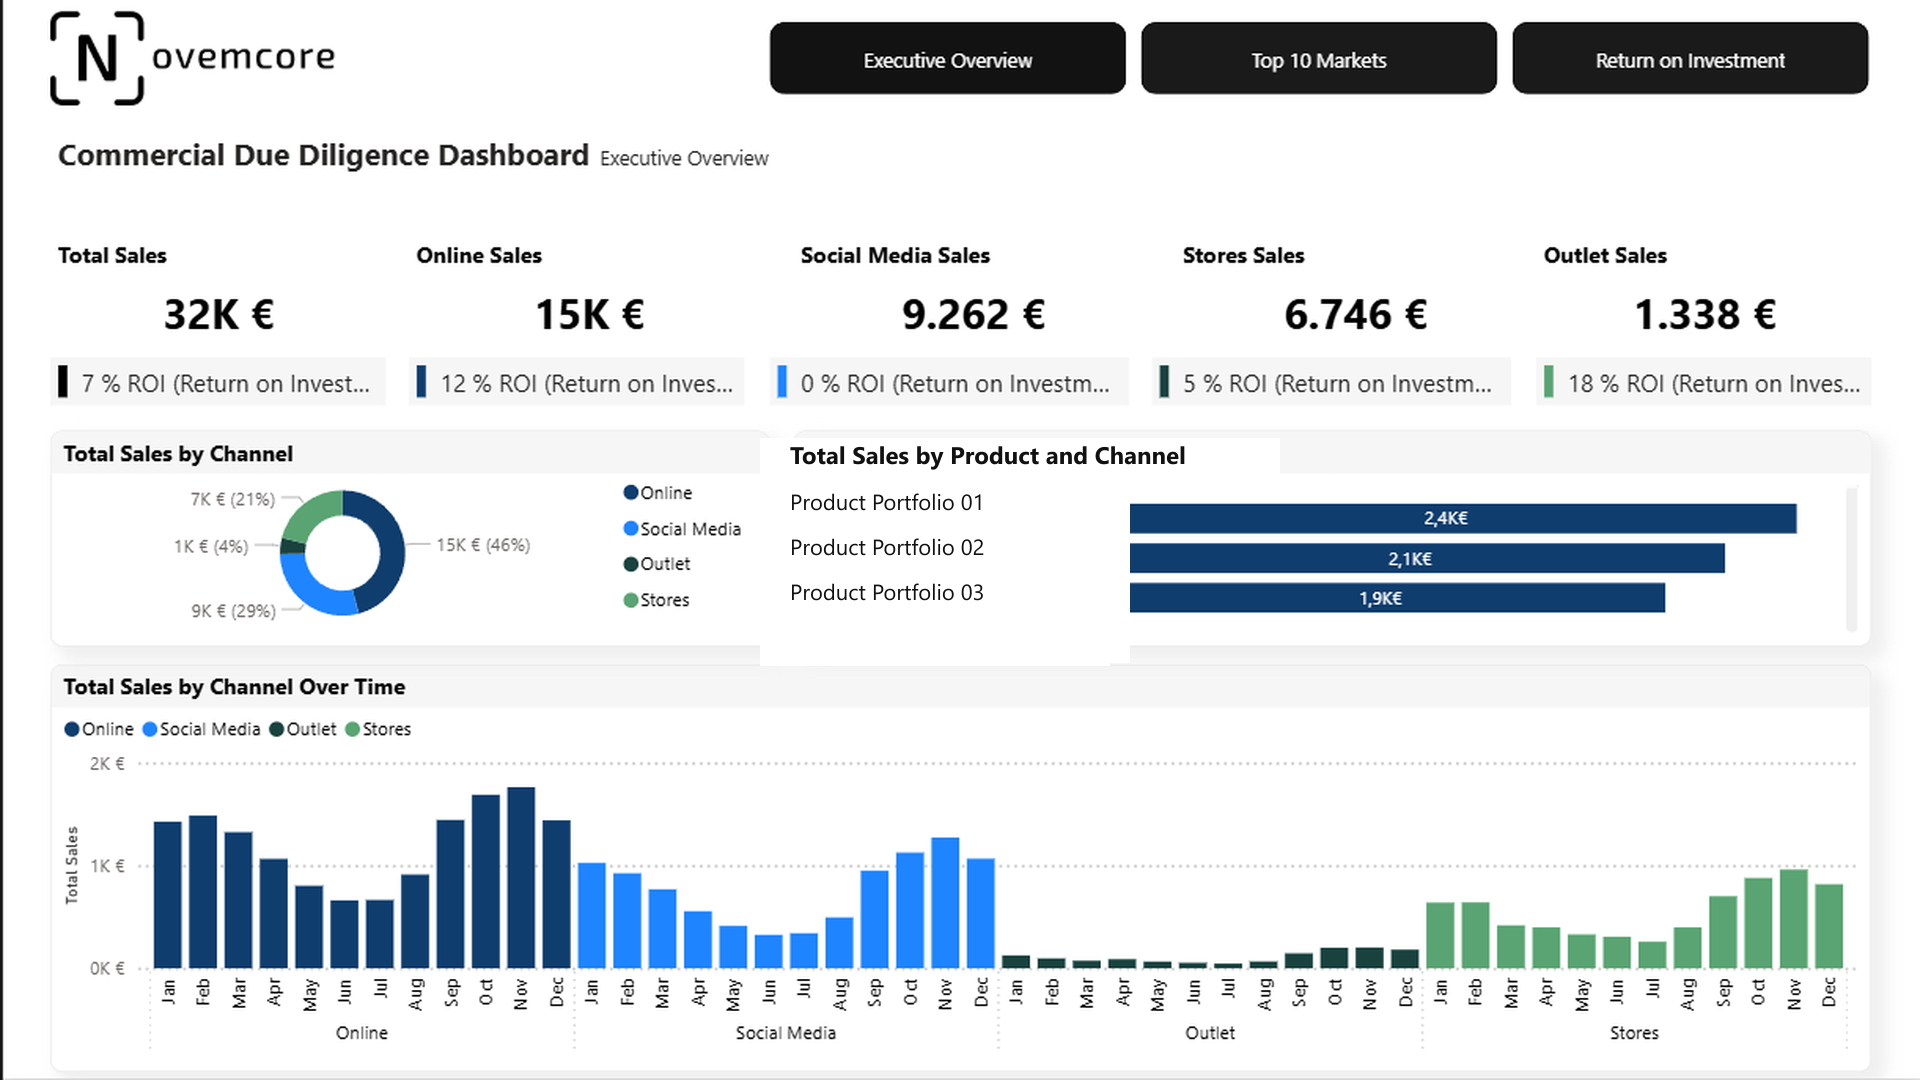
Anonymized dashboard reference. Selected views approved for publication are shown.
- Sales Contribution by Channel and Product Line
- Top 10 Market Sizing and Channel Penetration
- ROI Trajectory by Country, Product, and Vintage
What the dashboard shows
Available Dashboard Views
VIEW DETAIL
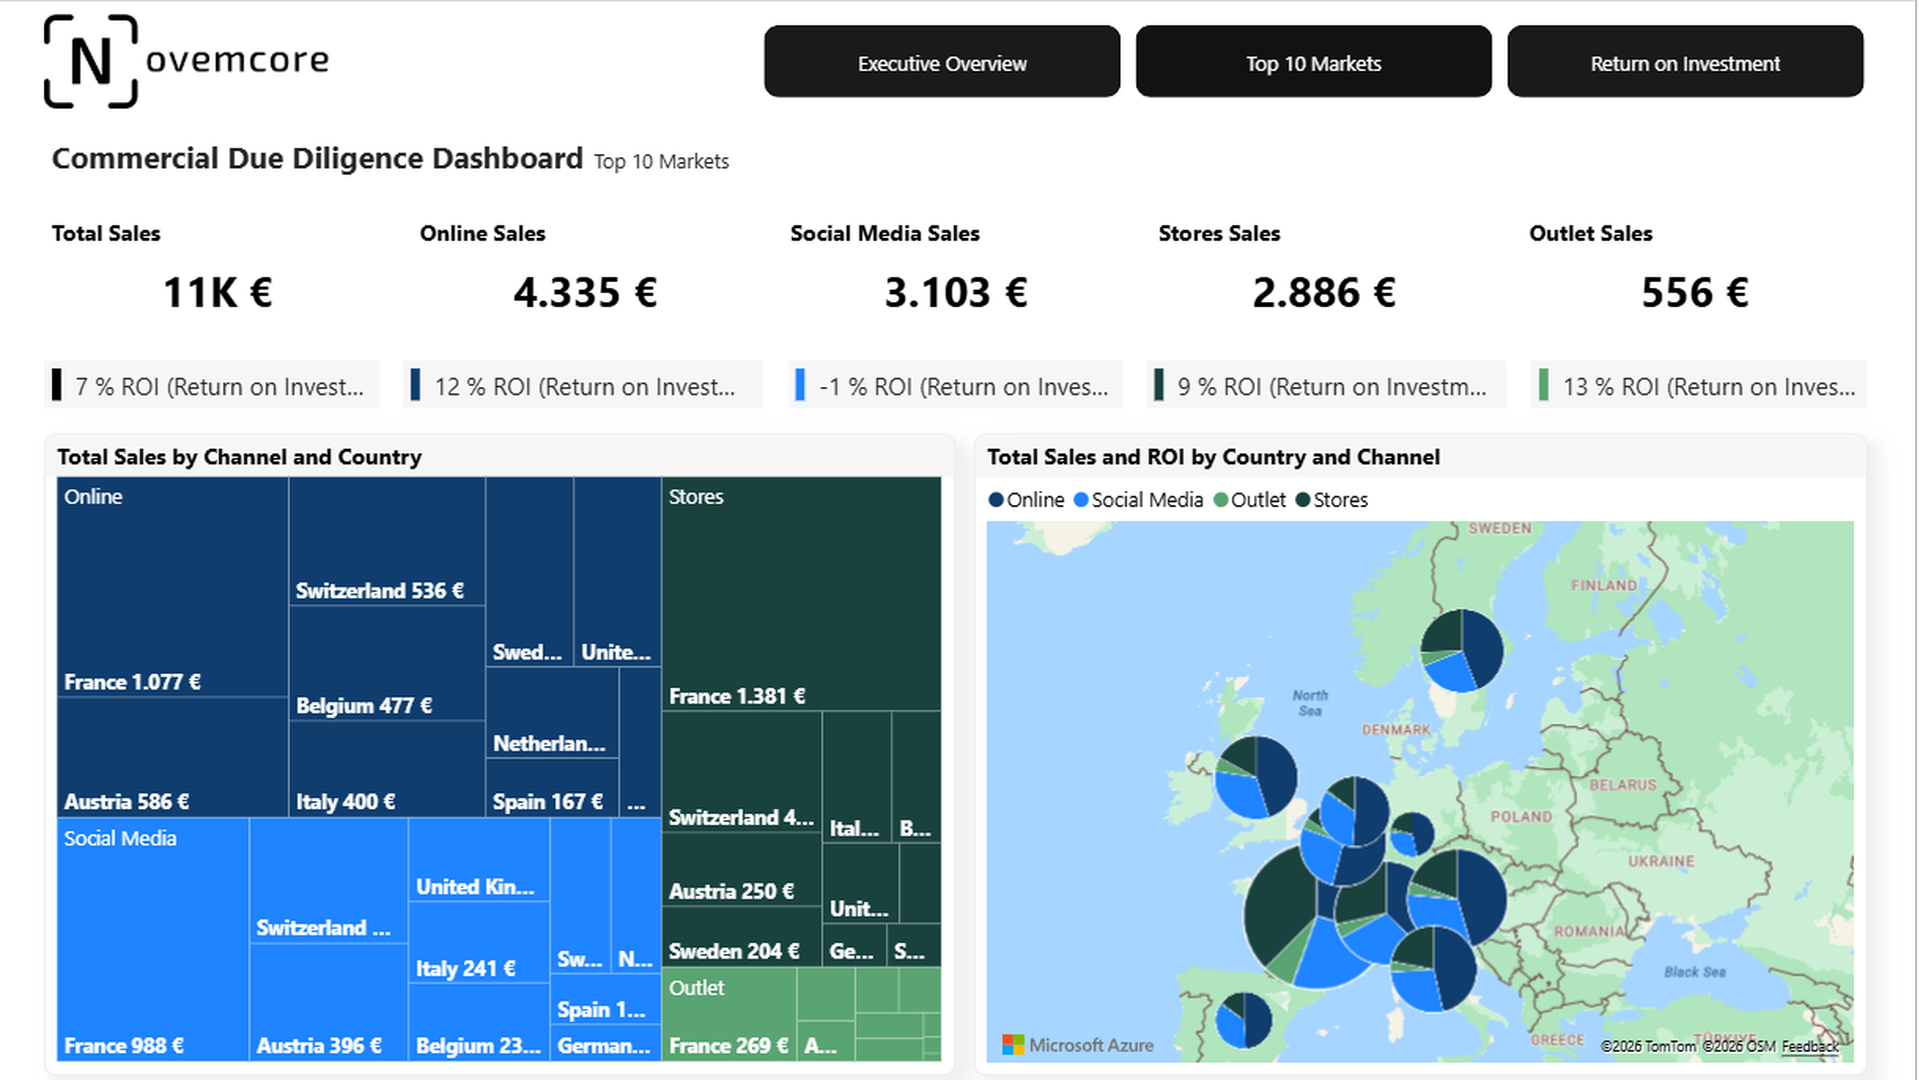
Top 10 Markets
Reveals geographic disparities by combining market scale, channel mix, and regional spread to highlight markets with the greatest commercial leverage.
Management value
Evidence-based market attractiveness scoring to guide expansion, focus, and resource allocation in M&A strategy.
VIEW DETAIL
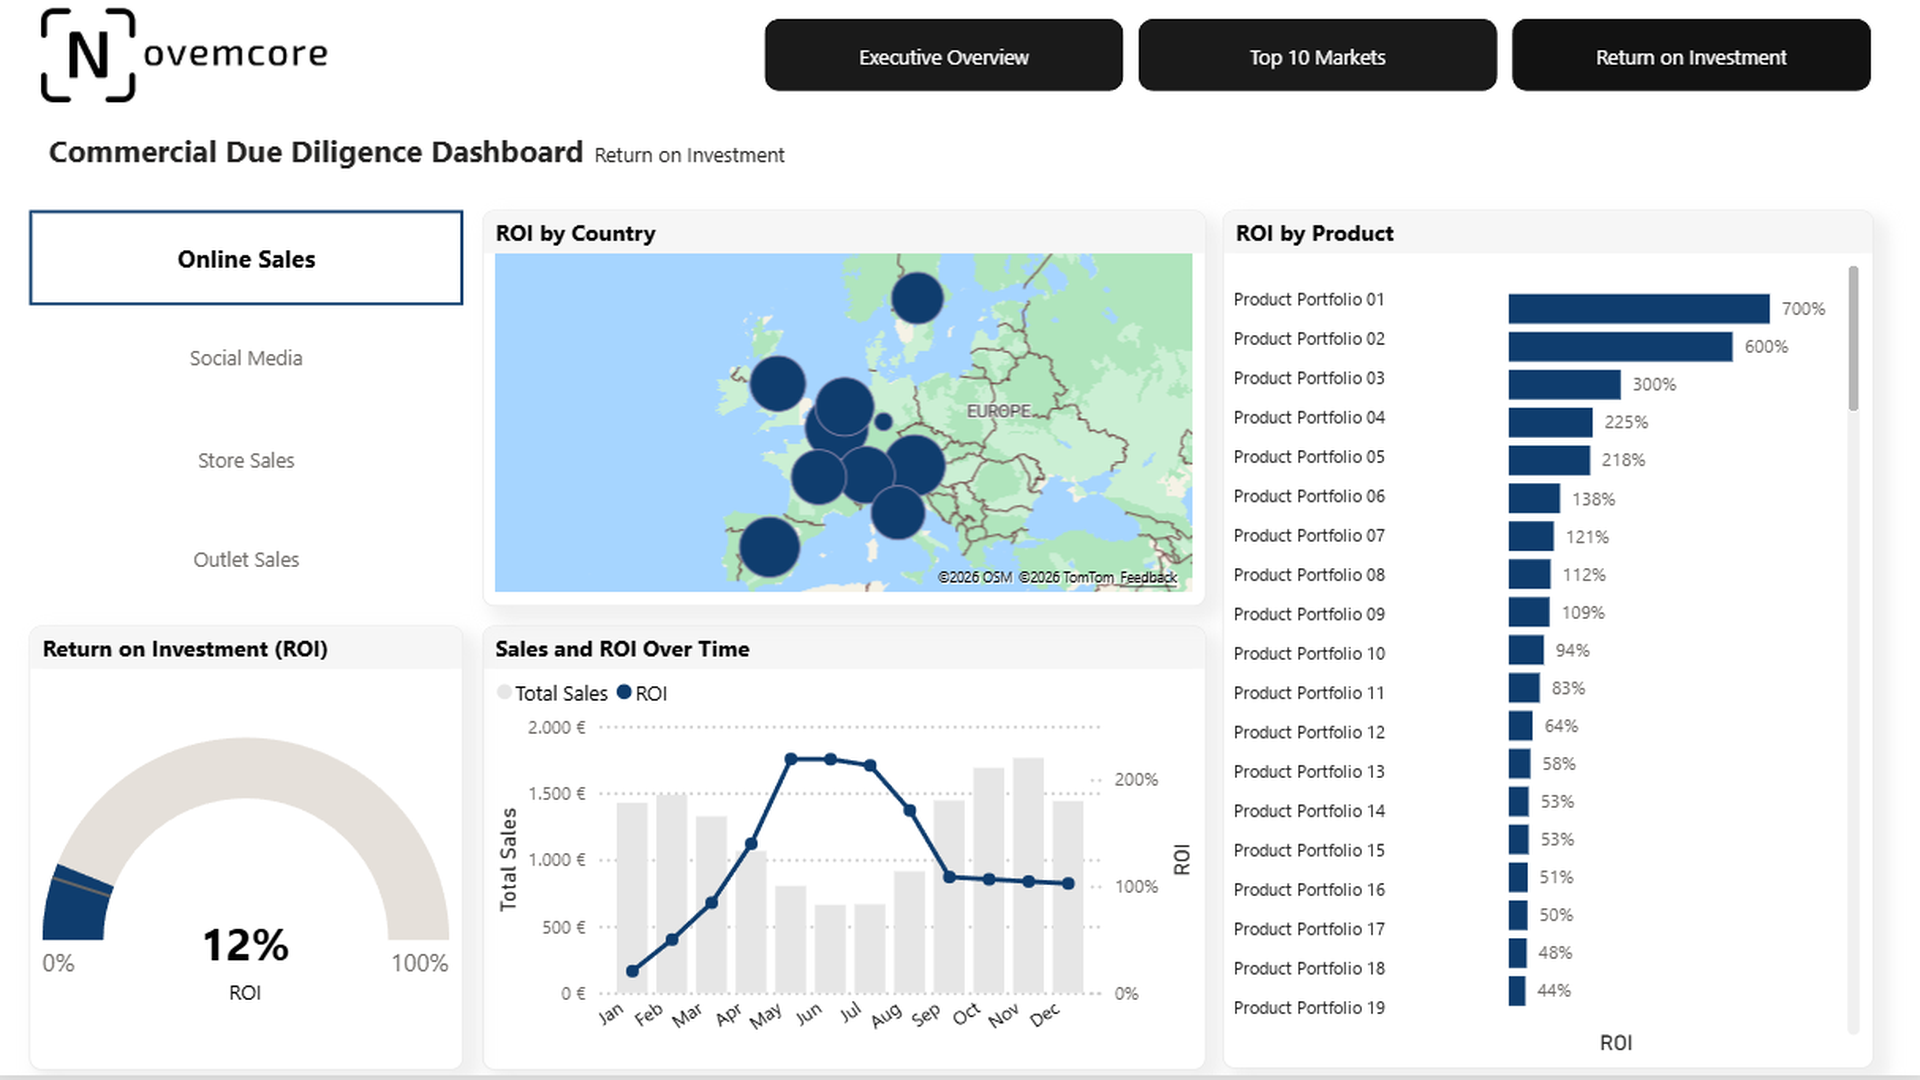
Return on Investment (ROI)
Translates commercial operations into capital efficiency, revealing which countries, products, and channels yield the highest ROI over time.
Management value
ROI tracking to ensure capital allocation focuses strictly on verified commercial value drivers.
- Executive Overview for swift appraisal of overall commercial scale and channel mix
- Top 10 Markets view for evidence-based regional market prioritization
- Return on Investment view translating commercial activity into capital efficiency
01Market Attractiveness Prioritization
02Geographic Channel Strategy
03ROI-Led Capital Governance
Next step
Discuss your reporting requirements Which decisions should your reporting support better?
We connect data modelling, KPI logic and Power BI development in a reporting solution designed around your steering processes.